Inventory forecasting is a market research technique that’s used to correctly predict the needed inventory levels for a future period. It’s also sometimes called “demand planning” or “demand forecasting.”
Working out what you’ll have, when you’ll have it, what you’ll need, when you’ll need it, and so on makes a massive difference when it comes to inventory management. Good inventory forecasting can:
- Keep your supply chain running smoothly
- Save your business money
- Help you to always have optimal inventory levels
- Protect your business from logistical problems
- Help with efficient distribution of resources
- Prevent stockouts
- Prevent underselling
- Predict future sales
- Help you be ready to leap on upcoming trends
- Optimize your storage
Efficient inventory forecasting will ensure you have enough stock to fulfill customer demand without having too much inventory draining your cash. By using inventory forecasting, your business could be reporting record profits in no time.
Here, we’ll show you how to get clever with forecasting. We’ll take you through everything you need to know about accurate inventory forecasting. We’ll look at what it is and why it’s useful before showing you how to do it properly.
If you’re looking for a one-stop guide to inventory forecasting, look no further. We’ve got you covered.
Automatically calculate the cost of your “safety stock”
See how Inventory Planner can transform your planning.
Core metrics used in inventory forecasting
Before we dive into all the aspects of inventory forecasting, it’ll be beneficial to go through the definitions of some core metrics used in demand forecasting and the replenishment process.
1. Sales velocity vs. average sales
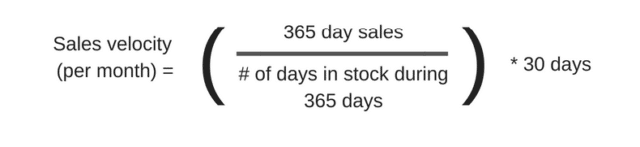
This is the rate of sales omitting stockouts (out-of-stock days). It’s very important to omit “out-of-stock” days rather than using average sales because average sales could lead to underestimated future sales.
For instance, let’s say you sold 15 T-shirts in 15 days, and the T-shirts were out of stock for the following 15 days. If you look at average sales over the past 30 days, it’s 15 T-shirts in 30 days, or 0.5 T-shirts per day.
However, that’s lower than the actual demand because you only sold 15 T-shirts due to stockouts. If you use sales velocity, the number of sales would be double the average sales in the last 30 days. Here’s a simple formula to help you calculate your sales velocity per month:
2. Lead time
In purchasing, it means the time it takes for your business to receive an item after ordering it from the supplier.
You can calculate lead times with this formula:
Lead time = Order processing time + Production lead time + Delivery lead time
If you’re not sure of your suppliers’ exact processing and production times, the formula can be simplified to Lead time = time from a purchase order is placed to the time goods are received on your side.
Here’s an example of how to use sales velocity and lead time in inventory forecasting and replenishment.
If you’re forecasted to sell 300 lime-flavored Jill’s Jelly Beans during the next 30 days, and you have 60 stock on hand. The lead time is three days.
- Sales forecast is 300
- The forecasting period is 30 days
- Sales velocity is ten per day (300/30)
- Current stock can cover six days of sales: 60/10 (sales velocity)
When to start replenishment to avoid out of stock: on day three because the lead time is three days, and your current stock can only cover six days.
Replenishment quantity: 240 (24 days (30 – 6 days) * 10 per day sales velocity)
3. Economic order quantity (EOQ)
The EOQ is the most cost-efficient quantity that a company should order. You can determine it with this formula:
EOQ = √2DS/H
- D = Demand (in units per year)
- S = Cost per purchase
- H = The cost to hold each unit (per year)
4. Reorder point (ROP)
ROP helps you to calculate replenishment rates. The formula is:
ROP = (Number of units used per day X Lead time in days) + Safety stock level
Let’s say you sell ten units per day, and the lead time is five days. You have eight units as safety stock.
Your ROP would be (10 X 5) + 8 = 58. So, when this item falls below 58 units, it’s time to reorder.
5. Inventory turnover
Turnover refers to the number of times you’ve sold and replenished an item within a year. It’s calculated using a ratio. The higher the ratio, the higher your turnover.
You can calculate an item’s turnover ratio like this:
Turnover = COGS (Cost of Goods Sold)/Average inventory
6. Average inventory
This refers to the level of inventory you have during any given period. It’s an average, so you should never take it as an absolute figure. However, it’s very helpful when calculating things like turnover.
To calculate your average inventory, you’ll need to pick a start point and an endpoint (usually the beginning and end of a sales year). Then use the following formula:
Average inventory = (Inventory figure at the start + Inventory figure at the end)/2
7. Safety stock
Safety stock is the amount of an item you need in your inventory to cover minor surges in demand.
You can work out how much safety stock you need using this formula:
Safety stock = (Maximum number of units sold in a day X Maximum lead time for stock replenishment) – (Average daily usage X Average lead time in days).
To break that down, let’s say that the maximum number of an item you’ve sold in a day is ten, but on average, you sell seven. When you reorder, it usually takes five days to reorder, but it has taken up to eight days maximum).
This item’s safety stock level would be (10 X 8) – (7 X 5) = 45
Now, you know how many days of overstock you have based on the current sales velocity.
Importance of efficient inventory forecasting
The forecasting process isn’t just about stock replenishment. It goes from forecasting future customer demand to planning when, what, and how much inventory should be reordered to meet demand.
Here are just some of the benefits of good inventory forecasting.
1. Prevents overstocking and out of stock
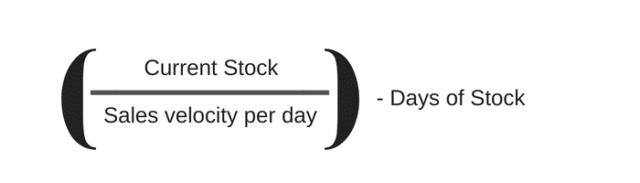
Wondering if you have more stock than you’ll need for the next 30 days? Or maybe you know you have too much, and you’re wondering how much overstock you have on hand. We can use the forecast to figure out how much stock should be on hand.
First, determine how many days of stock you want to have on hand. Days of stock are the number of days you want to cover with inventory stocked in your store or warehouse. Some considerations when determining your days of stock include:
- Lead time – how long will it take to receive products from your supplier? If you have a short lead time, you could also have shorter days of stock. However, if it takes 90 days to receive a new order from your vendor, you’ll want longer days of stock.Consider that days of stock are approximately equal to how often you’ll need to place an order. You won’t want to place an order every 14 days if it takes 90 days to get to you, leaving you with multiple orders in transit.
- What is the cost of being out of stock? That is, how much does each lost sale cost you? If an average day out of stock would cost you $10,000, you may want to have more stock on hand than if each stockout would cost you $100.
To determine the cost of being out of stock for a day, multiply your sales velocity per day times the retail cost of your product. Now, divide your stock by your sales velocity per day. Subtract that number from your targeted days of stock, and that will give you how many days you’re understocked or overstocked.
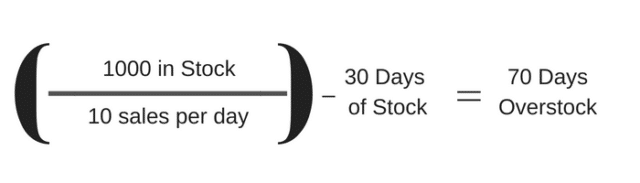
For example, you’ve 1000 candy bars in stock. Inventory should cover 30 days of sales, and you sell 10 per day.
2. Saves time on manual data entry and labor
Sales forecasting tips often include things like “log every detail!”
In fact, good demand forecasting reduces the need to manually input a ton of data.
Things like reordering, contacting suppliers, updating inventory logs, and so on all take a lot of time.
Good demand forecasting can massively reduce the time spent on stuff like this.
For example, if you know what you need in advance, it’s easy to automate things like reordering. Similarly, if you’re aware of what stock you’re likely to have at any point, you might not need to run a full stock check. A quick overview should be enough to tell you whether or not your predictions are on target.
All of this saves a huge amount of time. Rather than slogging away at data entry and stocktaking, your employees can be getting on with more skilled things like marketing, sales, and customer service, for example.
3. Releases cash tied up in excess inventory, improving cash flow
We’ve spoken above about the tendency for brands to hard-sell overstock. There’s a good reason why brands do this. Inventory represents money.
Ideally, you want to sell your stock as soon as possible. For perishable items, there’s a natural urgency, but the principle applies across the board. Even the most preservable items will gather dust and get damaged over time.
Unsold products have a lot of cash tied up in them, as well as occupy warehouse space that costs you money too.
Good inventory forecasting means that you won’t waste money on products that are just going to gather dust. This frees up resources to use on more profitable things.
Get it right, and your business cash flow will be a lot healthier.
4. Quick response to supply-chain changes
Fast reactions are important in business. For instance, if lead times get longer, a specific supplier increases fees, or shipping containers become more expensive, you need to adjust quickly in your inventory planning and purchasing process.
When inventory forecasting is done properly, factoring in important metrics such as lead times, days of stock, seasonality, sales velocity etc., you’ll be able to adjust forecasting quickly as soon as any market shift happens.
What is the difference between a forecast and replenishment?
A sales forecast looks at the predicted sales for a certain period of your choosing, i.e., the next 30 days.
Replenishment is the additional amount of stock needed to cover those sales. In other words, sales forecast or customer demand forecast is fundamental to replenishment decisions. The replenishment process usually takes into account:
-
- Consideration of current stock levels – how much is already on hand? How much additional product will be needed?
- Lead time from vendors – how long will it take from placing a purchase order with a supplier until that product is received into inventory?
- Stock on order – how much product is already ordered from your supplier and is scheduled to arrive during the time period under consideration.
- Returns – customer returns can potentially increase your future inventory level. You should take them into account to make better purchasing decisions.
Inventory forecasting methods
As we said previously, the end goal of inventory forecasting is to meet customer demand. So let’s go through the methods to predict demand first. Then we’ll walk you through other elements and the formulas you’ll need to accurately plan inventory purchasing. We’ll also introduce you to some great planning tools, as well as inventory forecasting best practices.
Let’s start with the five most common inventory forecasting methods. You can use these on their own or combine them for a more detailed result.
1. Trend method
Trend forecasting involves predicting changes in future demand over a given period of time. It’s done by analyzing past sales and growth data and looking for patterns within the forecast period.
Trend forecasting can be either top-down, bottom-up, or a combination of both (depending on the circumstances).
Top-down forecasting involves starting with high-revenue items and working your way down. Bottom-up forecasting does the opposite.
Both have advantages and disadvantages. For example, top-down forecasting is great for giving you a big picture of your best-sellers, but it misses a lot of detail. With bottom-up forecasting, on the other hand, you can get quite specific but may miss out on broader insights.
You can also focus on specific customer trends. For example, you might dive into a certain customer segment and analyze their sales patterns. This will help you to predict their buying trends in the future. Continue this over every customer segment, and you’ll get a picture of customer buying trends.
You can use this information to prime your supply chain and manage your inventory. It’s also useful for sales and marketing. For example, if your trend forecasting reveals that customers in the 30-40 demographic often buy a certain product, your marketing teams can tailor their content to that demographic.
Trend forecasting isn’t perfect, though. It doesn’t take seasonal effects, external events, or sales anomalies into account. To bring those into the picture, you’ll need to try other techniques.
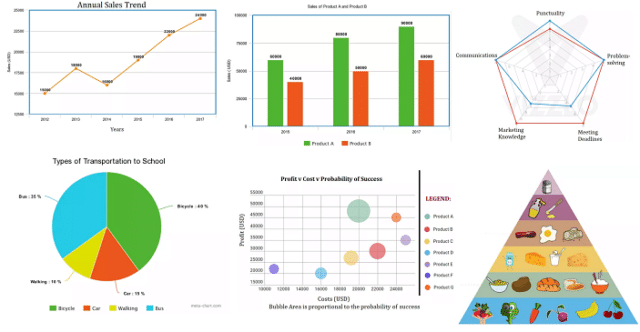
Graphical forecasting is less of a “method” in its own right and more of a way of presenting data.
Graphical forecasting involves taking data (for example, trend data) and turning it into graphs.
Many analysts like this because it makes trends, patterns, and so on easy to spot. Humans are very visual creatures. It’s quicker and easier to understand that sales are rising when you see an upwards line on a graph than it is if you’re presented with a sheet of numbers.
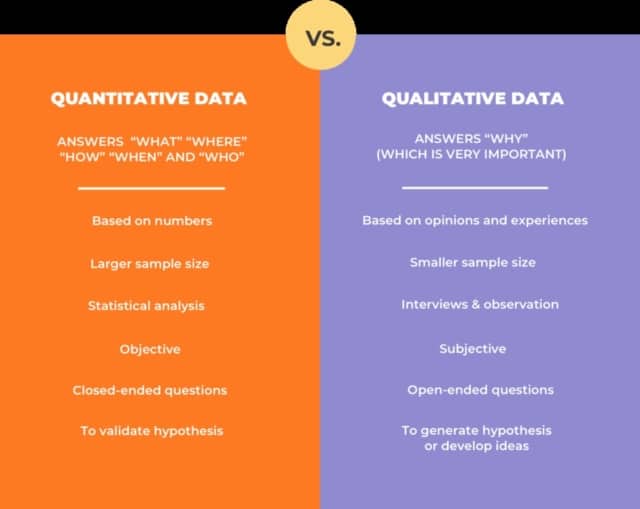
2. Qualitative method
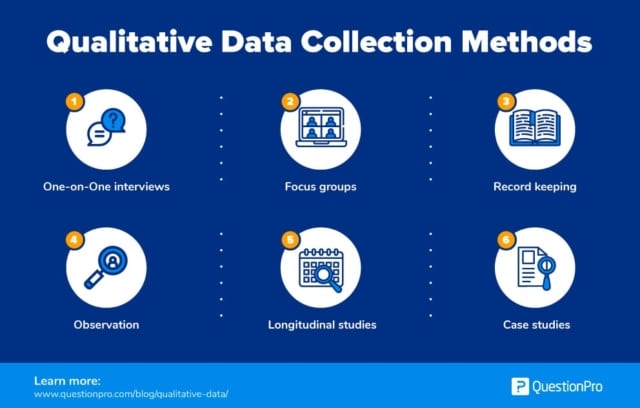
Qualitative data is complicated to obtain, but it can be very useful.
To gather qualitative data, you need to go to the source. With forecasting, this source will be your customers, your suppliers, or both. Ask them relevant questions, and then turn the answers into usable data.
For example, you might ask your customers questions like:
- What are your favorite products?
- What products do you buy the most often?
- What times of year are you most likely to buy X, Y, and Z?
- What features of our products do you like best?
- How long are you prepared to wait for delivery?
You can ask these questions through focus groups. Surveys, feedback forms, and even social media comments can also be a source of qualitative data. Forecasting for Amazon sellers, for example, often involves gathering qualitative data from customer reviews.
The data you get from qualitative research is often quite nuanced. It might take a while to gather and analyze, but once you’ve got enough, it will give you valuable insights. You can then use these insights to optimize your inventory.
3. Quantitative method
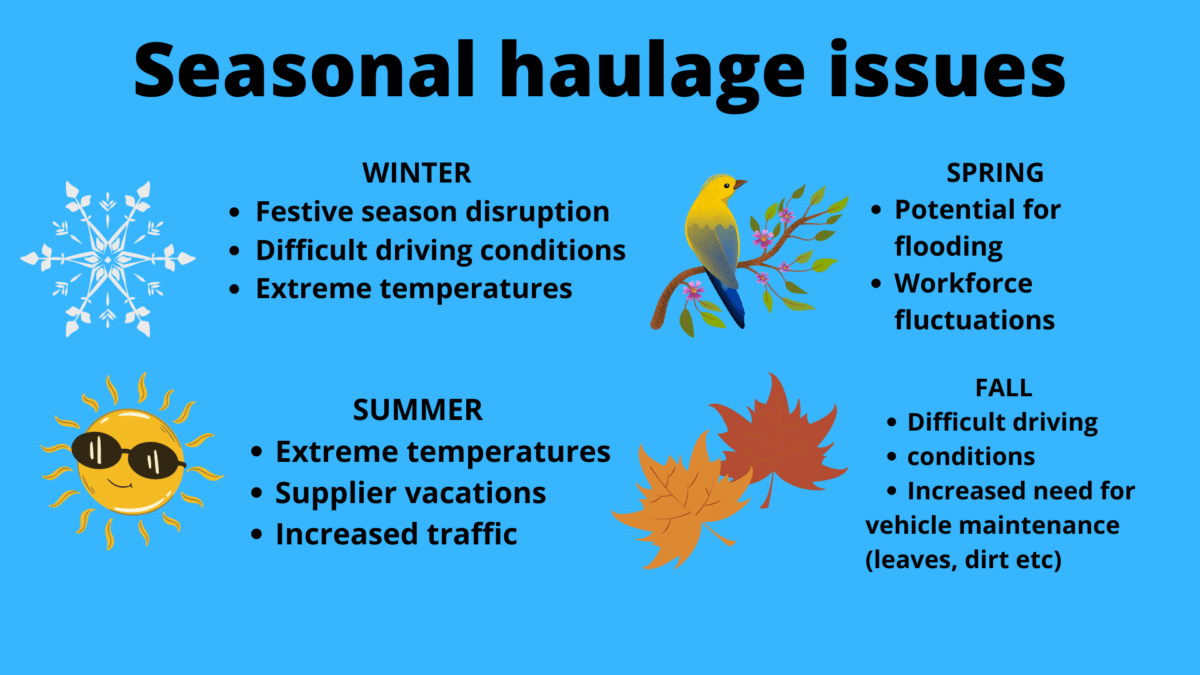
4. Seasonality method
Seasonal forecasting involves predicting demand according to things like:
- Seasonal weather
- Festivals (e.g., Thanksgiving, Christmas, Easter)
- Time-specific events (elections, for example, or anniversaries)
- Sales seasons (Black Friday, Cyber Monday, summer or winter sales)
Most brands will experience seasonal changes and fluctuations in demand. For example, a clothes retailer will sell warmer items in the winter and perhaps more party wear around Christmas. A grocery store may sell a lot around Thanksgiving and Christmas and less after New Year (when all those resolutions come into play).
Looking at past trends (both within your own brand and in the market as a whole) can be a great help for demand forecasting. For example, if you’re forecasting for an election year, look at sales during the last election. Did they rise, drop, or stay the same? Did any particular products do well? (Alcohol retailers often find that sales go up around elections…)
Understanding seasonal needs helps with everything from pricing to priming your supply chain.
How to choose the right inventory forecasting methods
Questions to ask when choosing an inventory forecasting method:
- What data do you already have?
- What data could you gain?
- How susceptible is your product to change trends?
- How diverse is your product range?
- How diverse is your customer base?
- How secure is your supply chain?
- What puts your demand at risk?
- What puts your supply at risk?
- What about wild cards?
None of these methods are foolproof. There’s always an element of chance with any of them.
However, you can bring your forecasting closer to being foolproof by combining some or all of these methods. Doing this will give you a bigger, more detailed picture of what’s gone on in the past and what might happen in the future.
Automated forecasting, even for seasonal trends.
See how Inventory Planner can transform your planning.
Let’s say, for example, that your company makes toys. Forecasting holiday sales (and common sense!) tells you that you’ll need to give your inventory a massive boost around Christmas.
But what products will you need most? Toy trends change incredibly quickly. Last year’s “it toy” is unlikely to sell out this year, so past quantitative and trend data isn’t much help here.
Add in qualitative data, however, and things change. By asking kids, parents, suppliers, and other industry professionals what kids are into, you start to see the kinds of products that are likely to be popular this Christmas.
While there’s no crystal ball, by combining quantitative with seasonal forecasting, you can make a safer bet on the kinds of toys you’ll need to stock up on this coming Christmas.
So, as a general rule, a combined approach is best. It provides a bigger picture, which, in turn, gives better insights.
That being said, you shouldn’t waste your time on methods that either won’t work for you or aren’t relevant to you.
For example, if you’re a new startup, you won’t have a ton of historical data. This makes things like seasonal and quantitative forecasting hard.
You have options, sure. You can use broader market data or even competitor data to get a rough idea of demand. However, this data won’t be as valuable as stuff from your own customers.
In this case, you should put more energy and resources into qualitative and trend forecasting. The data you have for this is more relevant and accurate for your own business.
Risk is another factor to consider when choosing a method. For example, if your brand is vulnerable to supply-chain delays, seasonal forecasting could be an important method for you. For example, winter conditions might delay deliveries, or summer might see a lot of your suppliers heading on vacation.
By using the seasonal method, you can plan ahead and proof your inventory against these kinds of issues.
Inventory forecasting for seasonal products
Seasonal products need to be treated differently from other products. A seasonal product is one that sells at a significantly different rate during a particular time of the year. Seasonal products can include items for sale around certain holidays. They can also be items like items in a spring collection or winter sports gear.
Let’s look at an example:
The flat-trending forecast projects steady sales from month to month.
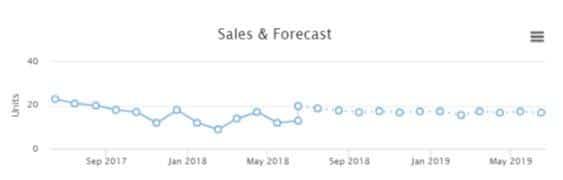
The seasonal forecast follows seasonal trends shown in the prior year, with spikes in sales in December and May.
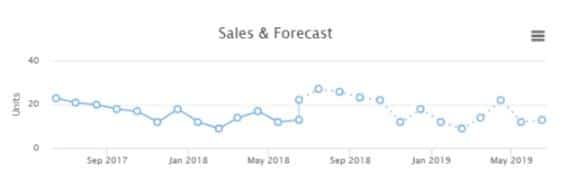
Unlike other products that sell at a steady rate all year or ones that see an increase in sales month over month, seasonal products have different considerations when calculating your forecast.
The flat-trending sales forecast will emphasize sales in the most recent months, taking into account if sales are increasing, decreasing, or holding steady. A forecast for seasonal products references trends from the prior 12 months.
How do you forecast sales for new products?
New products without sales history present a particular challenge when creating a demand forecast. There are two approaches:
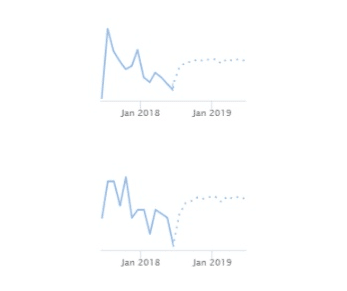
Observed trends for past product launches can hint at the expected demand from new launches.
Have other new products increased sales rapidly immediately upon release? Or is there a period when the new product is marketed to customers and sales increase more slowly over several weeks or months?
Examine the month-over-month increase for other new products. This approach assumes that similar product launch plans and resources will be invested in the new product.
As an example, previous product launches with gumballs, lollipops, and licorice saw strong sales in the first two or three months; then there was a drop off in sales during the following months.
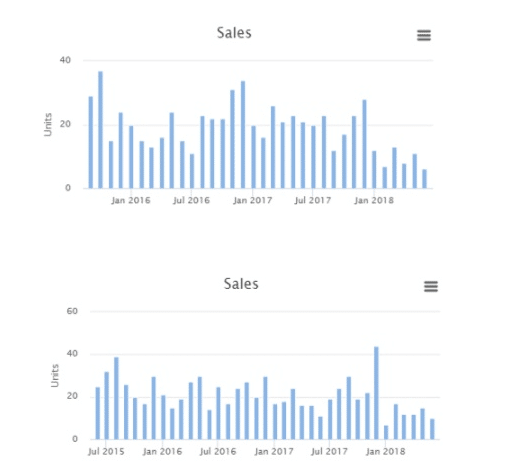
Applying that to our new jelly beans product, we can estimate that there will be a drop in sales after two to three months.
Look at sales trends within the same product category or brand.
Is there a particular type of product that sells well during the summer months? Or does one brand attract loyal buyers who will immediately consider a new release?
For example, Jill’s Jelly Beans shows solid sales across all available flavors. When considering orange as a new flavor release, we can look at the sales velocity of lemon and lime flavors to approximate the future sales for orange jelly beans.
Looking at other flavors, we see a pattern of a strong increase in the second month after launch, then a decline followed by another increase. Seeing this pattern in several other launch flavors can inform how the new orange jelly beans will perform.
How do you handle promotions when forecasting?
Your default forecast shows predicted sales continuing on the current demand trend. Promotions should change that trajectory, so how do you handle them when creating a forecast?
Future promotions:
If you’re planning a promotion during the forecast period, you’ll need to increase the forecast. Consider:
- Does the past sales information include previous promotions?
- If so, consider that the sales velocity already includes increased sales due to promotions
- If not, you’ll need to estimate how much your promotion will increase sales
- Keep in mind the cost of lost sales due to stockouts
- Promotions can lower margins, so factor that into your revenue planning
Past promotions:
If past promotions occurred during the period used to calculate the sales velocity, you might not need to increase the forecast – or not by much.
Using Excel for inventory forecasting
A premium inventory forecasting template will cost money. However, you can use an Excel inventory forecasting template for free.
Excel is a good tool for small businesses that want to automate part of their manual forecasting process. Excel already has an inventory forecasting formula. All you need to do is input your historical data into spreadsheets and ask Excel to calculate. Excel will then make a worksheet showing historical and predicted values.
It’s a good start, but it’s not sophisticated and is still manual as you need to pull in the data every day and adjust any metrics changes.
It’s also prone to errors if a formula is broken or the data isn’t imported correctly.
So Excel is not a long-term solution for forecasting.
Using specialized inventory forecasting software
We’ve covered different methods and formulas to forecast consumer demand and plan inventory purchasing above. But as you can see, all the forecasts need in-depth calculations to be accurate. So it can be challenging and time-consuming if done manually.
If Excel just doesn’t cut it for you (or if you want to complement it with something else), there are other flexible options for forecasting inventory management out there. Inventory forecasting software can be a huge timesaver and improve accuracy massively.
Criteria for choosing inventory forecasting software
When choosing inventory demand forecasting software, think about these factors:
1. Forecasting methods
Make sure that the software you choose fits in with your preferred forecasting methods.
If you run a seasonal business, you’d want the software to be able to handle seasonality. If you work a lot with trends, you want software that’s good at spotting patterns. If you use qualitative methods, your software needs to be good at taking in and interpreting a lot of complex data.
If you sell both seasonal and flat-trending products, make sure the forecasting method can be set at the product level.
2. Reliable and accurate forecasting
To be as prepared as possible, your forecasts need to be accurate and reliable. The software you choose can play a big part in that, but only if you choose the best.
As there are a number of variants that can influence forecasting accuracy, such as market shifts, out-of-stock days, fluctuating lead times, promotions, and festive seasons, you’ll need to make sure that the software you choose can factor in all those variants for higher accuracy.
3. Reporting capability
It’s critical to understand your inventory performance. So reporting is an important component of a good inventory forecasting software. Here are a few things to consider when it comes to effective reporting.
- Are the most important metrics to your business available in reporting?
- How granular can the reporting go? Can you report by SKU, variant, bundle, or warehouse?
- Can you get alerts when inventory is running low or overstocked items?
- Can the reports be automated and shared across your team?
- Does the reporting help you identify trends and best or worst sellers?
4. Integration with existing tech stack
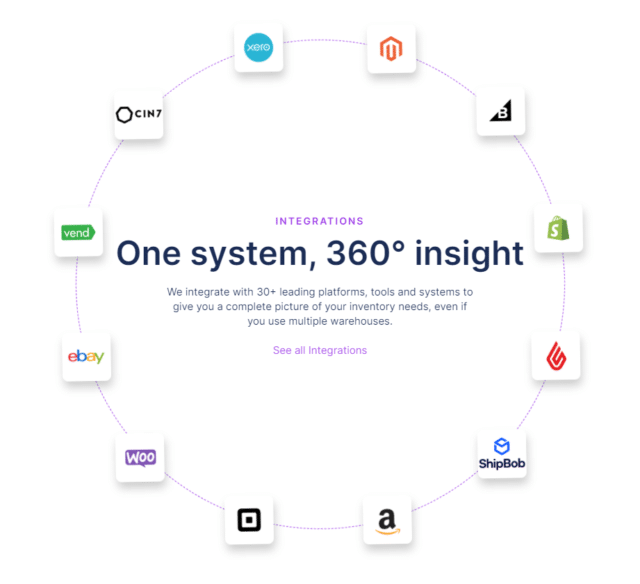
You want to make sure that the inventory forecasting software can seamlessly be integrated with the rest of the tech stack, including your online sales channels, accounting, shipping, inventory management, warehouse management, order management, or any other software that matters to your business.
5. Easy PO creation
PO (Purchase order) creation is a big part of inventory management. The right software can make this incredibly easy. In some circumstances, PO creation and sending can even be automated.
Make your life easier. Pick software that takes the hard work out of POs.
6. User-friendly
5 characteristics of user-friendly software
- Intuitive
- Easy to implement
- Forgiving
- Available anywhere anytime
- Configurable
You can train people on how to use your software. But this is a lot quicker, cheaper, and easier if the software is user-friendly. Look for something that’s intuitive and simple to use or, at least, comes as close as possible to your team’s existing skill level.
7. Enhanced data security
Demand forecasting and inventory planning involve a lot of data.
Any data is sensitive. Customer data is especially sensitive. If you don’t protect it, you could end up with huge fines under data–privacy legislation worldwide.
The trouble is that data is also very valuable. This makes it vulnerable to cybercrime.
To keep your inventory and demand forecasting data safe, it’s vital that the software you choose has enhanced data security. Don’t go for anything that can’t promise the most up-to-date and effective security features.
8. Implementation and support
Onboarding and ongoing support play a big part in how well any software service works for you.
You’ll want clean sales data and warehouse data to be connected to the software for accurate forecasting, but it can be challenging to implement the software and configure forecasting models properly for your business, especially when you sell on multiple channels and use multiple inventory locations. So implementation and support are crucial for ensuring a smooth software experience.
Other best practices to ensure accurate inventory demand forecasting
1. Collaborate with your team members
Forecasting inventory management is a team sport. Your colleagues almost certainly have a lot of great insights to offer. At every level of your company, you can collaborate to improve your demand forecasting.
For example:
- Warehouse staff have direct experience with inventory ebb and flow
- Marketers understand what your customers want
- Customer service staff deal directly with demand
All of this knowledge is very helpful when forecasting inventory demand.
2. Plan ahead
Forecasting and inventory management are all about planning ahead. So why not plan ahead to plan ahead?
Clear time in your schedule for inventory forecasting. Your forecast will run smoothly if you’re ready for it.
At the same time, be prepared to make changes. Watch out for announcements of upcoming events, and plan these into your forecast as early as you can.
3. Use real-time data
Real-time data helps you to keep your forecast accurate, even in a rapidly changing world.
By incorporating real-time data on an ongoing basis, you can nail demand forecasting in inventory management. Using real-time data as well as historical sales data means your forecast will stay agile. You can quickly respond to new trends or events without overstocking or understocking.
Real-time data is especially useful if you’re just starting out or if you’ve recently changed direction. In these cases, you might not have enough historical data to feed your inventory forecasting system. By using real-time data, you can bypass this issue and still get the benefits of a good inventory forecast.
4. Evaluate sales trend
We’ve just talked about how demand forecasting inventory management is best with real-time data. You can get a lot of that real-time data by evaluating sales trends.
Inventory planning software is a good source of sales data. It will report on surges and drops in sales of each item. Your team members – especially customer-facing team members – can also be helpful with this. Ask them about trends they’re witnessing in their day-to-day work.
You can use this data to understand:
- Your customers’ needs
- The direction the market is going
- Seasonal trends
- Product popularity
Storing this data will both help you with future forecasts and make sure you have enough inventory in the present. Plus, as we discussed above, by incorporating trend data into current forecasts, you can keep things agile and up to date.
5. Always monitor the inventory turnover
Manually monitoring your inventory turnover might seem to go against the inventory forecasting meaning. In fact, it’s an important part of the process.
Inventory forecasting takes a lot of the pressure off when it comes to monitoring your stock. But that doesn’t mean you should totally take your eye off the ball.
Watching for anomalies in inventory turnover will help you to react in good time. With inventory monitoring, you’ll stay in control.
Monitoring inventory turnover isn’t difficult with the right software. Set up your inventory planner to regularly report on stock levels and turnover.
This will keep you up to date on things like current sales trends, real-time issues, problems with stock, and so on.
6. Utilize all collected supply and demand data
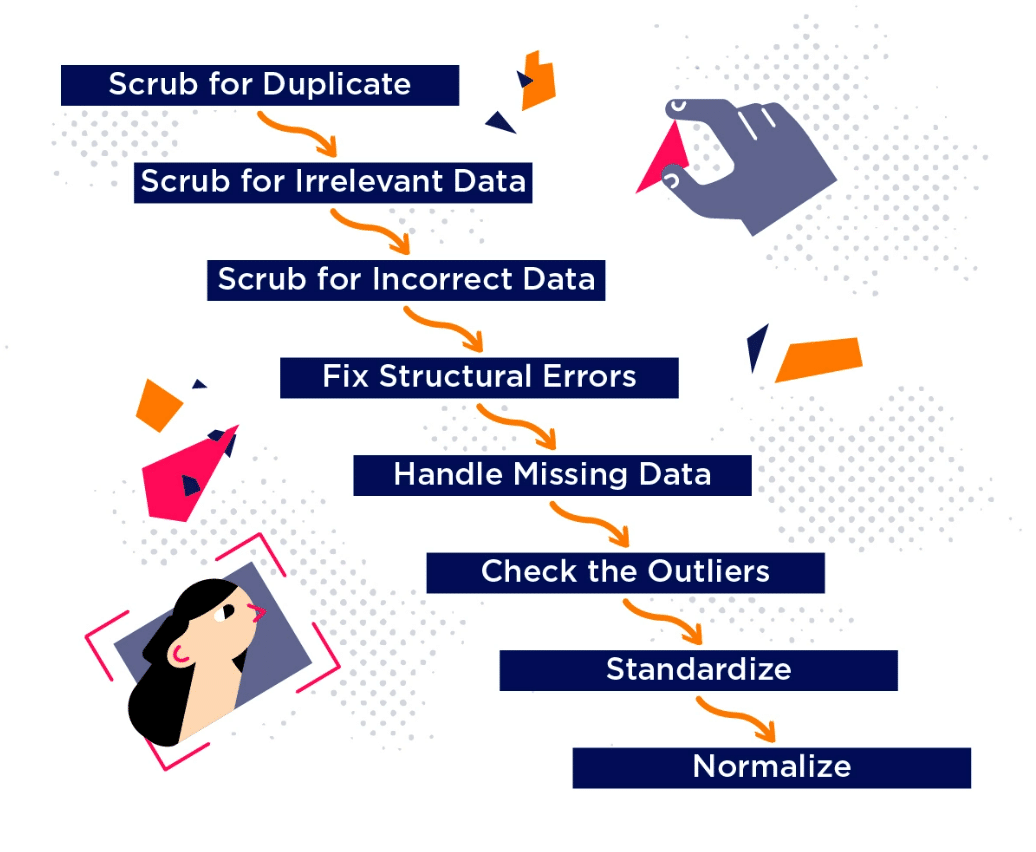
Image Source
Don’t let any supply-and-demand data go to waste. Pour it all into your forecasting techniques for inventory management.
You might need to clean your data before it can be useful. This involves things like merging duplicates, weeding out errors, and so on. Don’t worry – the right software will do a lot of this for you automatically.
7. Maximize an inventory management app
The benefits of inventory planning software are enhanced when the solution is combined with an inventory management app. That is a real game-changer because it makes inventory planning and forecasting a whole lot easier—and a whole lot more effective.
Leverage Inventory Planner for an advanced inventory forecasting
Demand forecasting for inventory control sounds complicated. If you’ve read this far, you’ll know that there are a lot of inventory forecasting elements to any good plan.
However, just because there are a lot of moving parts, it doesn’t mean that your forecasting has to be difficult.
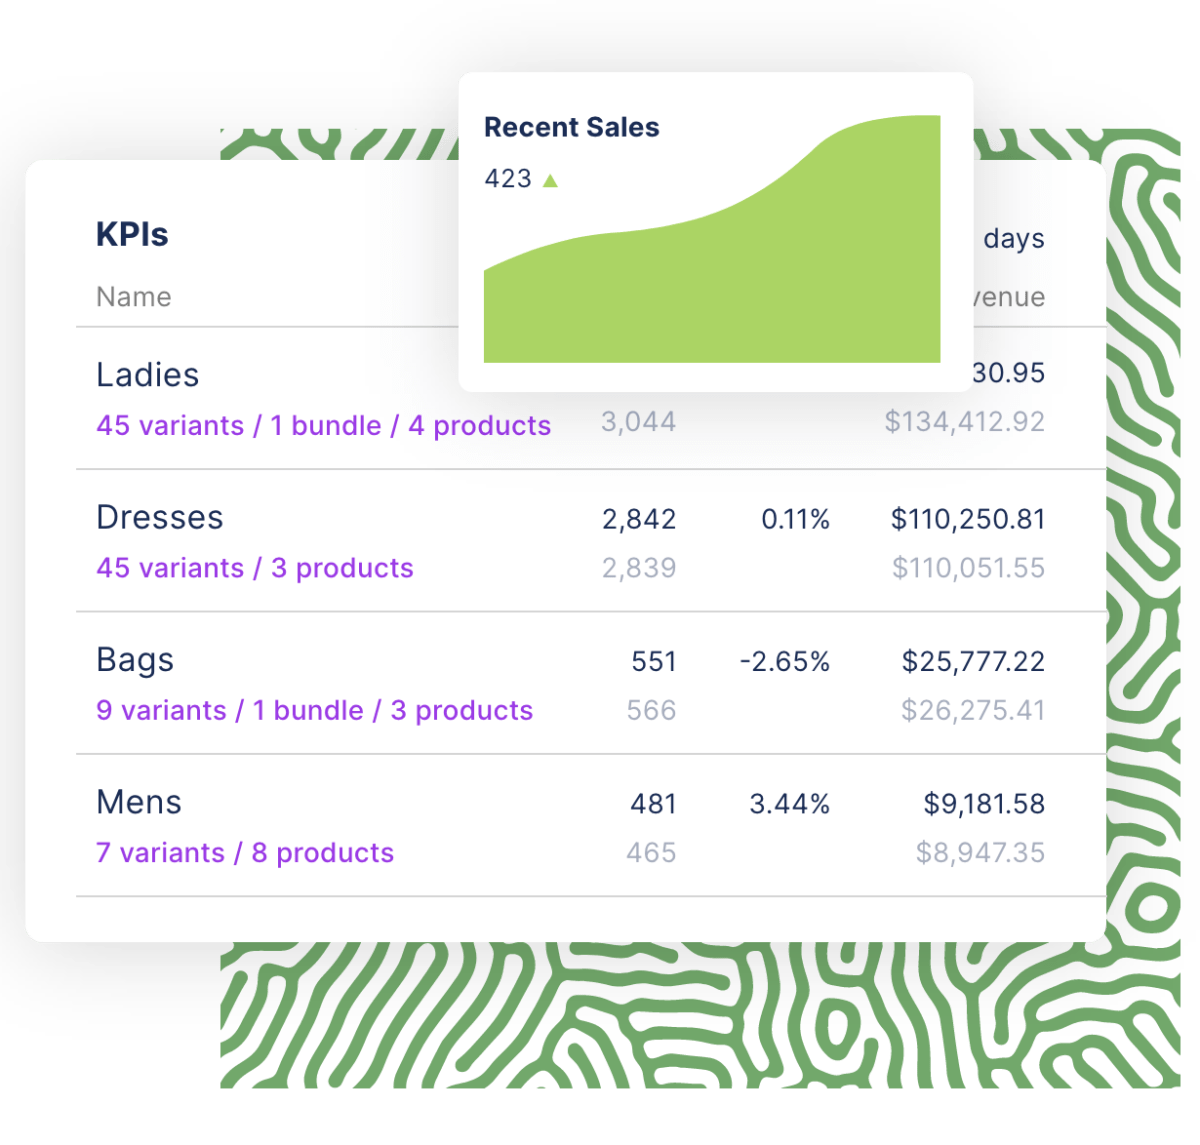
Inventory Planner is more than just an inventory forecasting calculator. It uses your sales data to identify your customer demand pattern, and tells you when and what to buy to meet the demand. It also provides you with inventory KPI reports to give you 360-degree insight. ,
If you need an intuitive e-commerce inventory planning software with reliable inventory forecasting analysis and replenishment recommendations available, Inventory Planner is for you.