Every business wants to be able to see into the future. But while we haven’t perfected the crystal ball (even if we can sometimes forecast new products), we can use other tools to make educated decisions.
For example, Microsoft Excel can be used for forecasting—using algorithms and drawing on data from the past to forecast values and make the right choices in the future.
However, Excel is a basic forecasting tool. It’s good for businesses as a starting point, but it’s still very manual compared to inventory planning software, such as Inventory Planner.
We’re going to explore how forecasting data in Excel predicts demand by looking at the various tools Excel offers. We’ll also show you the upsides and downsides of using forecast worksheets in Excel.
When to use forecasting in Excel
Before considering the advantages of Excel to forecast statistics, it may be worth considering the value of forecasting in the first place. In simple terms, forecasting predicts trends and opportunities that your business can exploit going forward. This is an activity undertaken by both old and new companies and shapes business decisions like budgeting, hiring, and broader business policies.
Excel is used in forecasting because it has a range of relevant tools at its disposal. Data can be easily stored and calculated in an Excel workbook. However, it still requires manual data sync and updates, so may not be the right solution for scale-up businesses.
Crucially, Excel can also visualize data in a variety of ways, which is essential to making forecasts more easily. There are a variety of formulas that can be used in an Excel workbook to help you calculate predicted values.
Once you have your data set entered into an Excel workbook, Excel can help you find a variety of things, including:
- Values range
- Aggregate values, like the sum and average of your values
- Duplicates
If you’re new to using Excel for forecasting purposes, search online for a tutorial that demonstrates features like how to:
- Fill missing points using a formula applied to the forecast sheet
- Calculate time series using the stat function
- Create a line chart for your forecast by completing steps like entering an end date in the forecast end box
If you have files or databases outside of Excel, it’s often easy enough to connect them to Excel and import the relevant data as well.
Up-to-date forecasting without manual data entry
Get a free interactive demo of Inventory Planner
Pros of Inventory Forecasting in Excel
Inventory forecasting in Excel (as opposed to other tools) has the following advantages:
1. Excel forecasting saves money
While the long-term goal of forecasting is to increase profitability, its ability to help you save money is equally appealing. Excel offers an affordable entry point for forecasting, often available as part of business plan subscriptions priced in the single digits. This makes Excel a cost-effective choice for businesses with smaller or simpler inventory needs, especially when compared to more specialized tools. For many, its low cost and broad functionality make it a compelling option.
Excel’s cloud sync features also enhance productivity by enabling team collaboration on a single file, no matter where employees are located. This streamlined workflow saves time and increases efficiency, allowing teams to accomplish more in less time.
However, for businesses managing larger or more complex inventories, dedicated inventory planning software offers a more powerful and cost-effective solution. Tools like Inventory Planner can help you optimize your purchasing budget based on a variety of dynamic metrics and KPIs, reducing waste, and ensuring smarter, more strategic inventory decisions—delivering greater savings and efficiency in the long run.
2. Excel forecasting is customizable
Another advantage of Excel is that the software can be customized in a variety of ways. When you’re creating a visual forecast, for example, you can tweak various aspects of it.
Obvious areas of customization include where the timeline you’re using to forecast starts from and how wide the timeline range is. You can also see information on the forecast’s confidence interval, which tells you how likely you are to get the same result upon repeating the forecast.
If you need to, you can also fill in missing points during the forecast process. If you have a good understanding of statistics, you can even take advantage of other features like displaying smoothing coefficients and error metrics.
3. Excel has different forecasting functions
Excel supports several different functions, which allow you to actually put the software to practical use. Understanding these is the key to getting the most out of Excel.
The forecast.linear() function allows you to calculate a value by drawing upon ones that already exist, i.e., known_x values and known_y values. It’s a good choice if you can see a linear trend in the data in front of you.
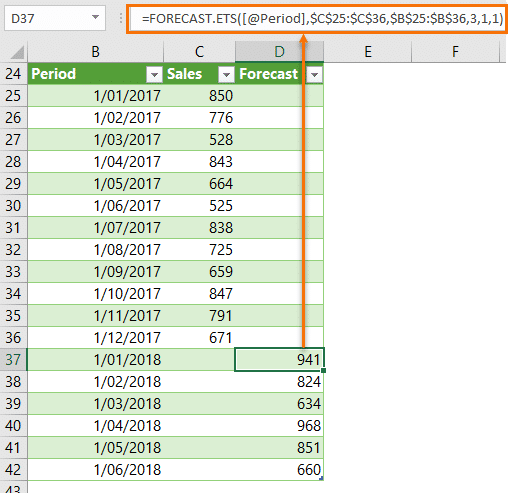
Naturally, there are other functions you can draw upon in Excel. The forecast.ets function uses both existing values and the triple exponential smoothing method for more advanced forecasting techniques.
The forecasting.ets.seasonality() function, meanwhile, tells you how many seasonal patterns are in the relevant timeline.
There’s even a function to return a confidence interval for a specific part of your forecast. Whatever your requirements, Excel probably has what you’re looking for, provided you’re willing to invest the time to understand it.
Of course, we at Inventory Planner have our own forecasting methods. These help you replenish your stock at the right time and centralize all of your sales channels as well.
Cons of Inventory Forecasting in Excel
1. Excel forecasting is time-consuming
With Excel, data syncing and updates are manual processes, which can become increasingly cumbersome as your inventory scales. Managing large datasets often requires a dedicated resource just to maintain and update the forecasting spreadsheets. While Excel’s subscription fees might be lower than dedicated software, the associated labor costs can quickly offset any savings. In contrast, inventory forecasting software automates data syncing and updates in real time, significantly reducing the time and effort required while freeing up your team to focus on higher-value tasks.
2. Excel forecasting is prone to error
Human error is a major risk when using Excel for inventory forecasting. Errors can arise from incorrect data imports, broken formulas, or simple mistakes during data entry. Even a minor misstep can lead to inaccurate forecasts, potentially resulting in costly overstocking or stockouts. By contrast, dedicated inventory forecasting tools are designed to minimize errors by automating data processing and calculations, ensuring more accurate and reliable forecasts.
3. The learning curve for Excel can be steep
Excel requires users to understand complex formulas, macros, and data models to create effective forecasting solutions tailored to their business needs. Building and maintaining such models often demands advanced Excel skills, which can take significant time to acquire. On the other hand, inventory planning software is designed with user-friendly interfaces and built-in forecasting algorithms, making it easier to implement and use effectively—even for non-technical team members.
4. Excel forecasting is not scalable
As businesses grow, Excel’s limitations become increasingly apparent. Spreadsheets struggle to handle large datasets efficiently, often leading to sluggish performance and processing delays. While Excel might work well for smaller businesses or simpler inventories, it cannot keep pace with the needs of larger or more complex operations. Inventory forecasting software is built to scale with your business, offering robust performance and advanced features that can process vast amounts of data without compromising speed or accuracy.
5. Excel forecasting is not in real-time
Excel relies on manual data entry, meaning the data used for forecasting is often outdated by the time it’s processed. This lack of real-time insights can lead to suboptimal inventory decisions. In contrast, inventory planning software integrates directly with your systems to provide real-time data, ensuring that your forecasts are always based on the most current information. This real-time capability allows businesses to respond quickly to changes in demand or supply chain disruptions.
Excel forecasting methods
Forecasting in Excel can be approached from a variety of different angles. Understanding these will allow you to make more accurate predictions about your future course of action.
1. Moving average method
This forecast method lets you “smooth out” data, look at its underlying patterns, and estimate future values. You typically do this for three-month or five-month timespans, both of which can be explored in a single spreadsheet.
Start by creating three columns in Excel: one with your revenues from the last year and two more for three-month and five-month moving average predictions. To work out your three-month moving average, take the average revenue you’ve earned from your current month and the two preceding it. Then apply the formula =AVERAGE(Data Range) to it to get the information you need.
Calculating the five-month moving average works in a similar fashion. However, you take average revenue from five months rather than three and apply the same formula to it.
2. Straight line method
The straight line method is ideal for forecasting beginners and allows you to predict future revenue growth. To do this, however, you need to have a good idea of what your business’s sales growth rate (expressed as a percentage) will be. You can work this out by looking at your business’s historical performance.
When you’ve your growth rate to hand, set up several columns in Excel. Label each one with a year, labeling them consecutively as you do so. Then, starting from this year, take last year’s revenue figure and multiply it by your growth rate. By highlighting subsequent cells and using the Ctrl + R shortcut, you can apply this calculation to future years.
3. Simple linear regression method
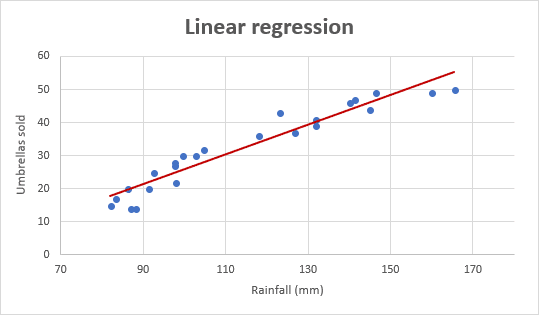
Linear regression is a type of analysis called regression analysis, which examines the relationship between two different variables. For example, we might want to see the relationship between the money we spent on advertising and the revenue we earned within a given time period.
To better visualize the impact (good or bad) our spending had, we need to create three columns. Fill one with each of the 12 months, and then put (in this instance) the corresponding amount of adverts run and revenue earned.
Next, highlight the two columns containing data, and insert a scatter chart into the spreadsheet. Then, add a linear trendline to the data points; while you can play around with the chart’s visuals, this should give you a good idea of your actions’ impacts.
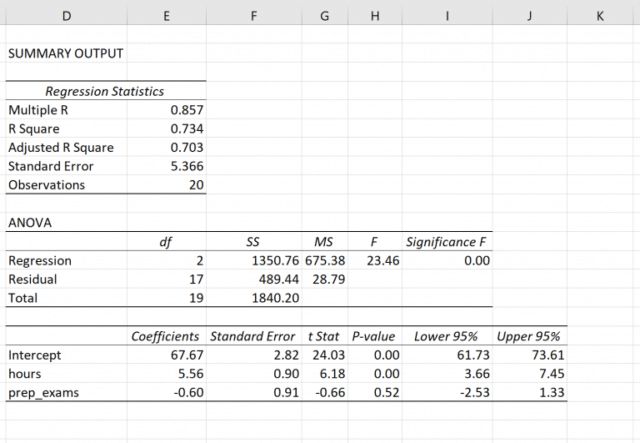
4. Multiple linear regression method
This forecasting method works in a similar fashion to simple linear regression. The difference is that you examine the relationship between several different variables. You might want to compare two different advertising methods to your revenues, for example. The advertising methods here are referred to as the explanatory variables, and the revenue is known as the response variable.
Set up your data in a similar manner to the simple linear regression method discussed earlier. Once this is in place, we can use the Regression command in the Data tab (click on Data Analysis to find it) and put data in the Input Y and Input X ranges. In this scenario, the data for the advertising methods goes in the Input X Range, and the revenues go in the Input Y Range.
Once the data is entered here and you’ve picked an output range (i.e., a cell where the output of your calculations is displayed), hit OK. You’ll see a group of output tables, which you can then interpret.
In case it wasn’t already clear, linear regression requires some understanding of statistics in order to be used effectively. As such, they may not be the best option for beginners in this particular field.
Choosing the right Excel forecasting models
As you can see, choosing the right forecast model in Microsoft Excel is shaped (at least partially) by your business demands. If you’re looking to better understand your recent business activity (and what it means for your business going forward), then the moving average method might be your best option. Similarly, if you’re keen to understand what revenue you can expect in the months ahead, the straight line method is a solid option.
Linear regression is ideal if you’re looking to make more sophisticated connections between different aspects of your business. That said, while assembling the data is relatively simple, you will need some specialist knowledge in order to interpret it.
How to build an Excel forecasting model
The best way to build a useful, intuitive forecasting practice within your business may be to use some kind of template. Choosing a template automates some of the calculations you need to perform and can prove very intuitive.
A template can also help you clarify what you want to achieve with your sales forecast, like expected revenue in general or from a specific product. Once chosen, a good forecast template can assist you with tasks like introducing a new product or making radical changes to an existing product line.
Fortunately, there are several different templates available for you to draw upon when attempting to forecast your business success with Excel. Forecast templates work similarly to Excel balance sheets, but you’re using the data in them as a reference for your future financial status.
Forecast templates require you to consider all your revenue sources in order for them to be useful (e.g., total sales, stock value, interest on deposits, etc.). You must also have a good idea of expected increases in revenue and a comprehensive list of your expenditures (like wages, debts, loans, taxes, advertising, etc.).
Templates for Excel forecasting models
While there are many different forecast templates to choose from, we’ve picked out three kinds that we think are particularly useful. Excel forecast templates are used by a variety of businesses (and sizes of businesses). However, the accountants within them will probably be the ones who understand them best—and put them to the most practical use.
Automate your Excel forecasting with Inventory Planner
See how Inventory Planner can reduce errors and effectively plan inventory.
To choose the best forecasting template in Excel, read on:
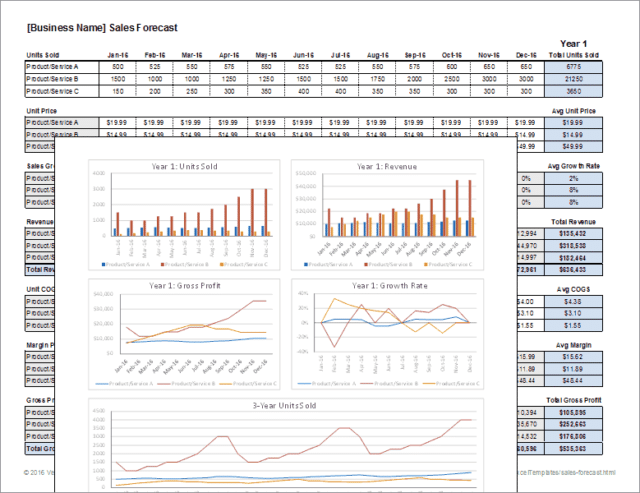
1. Monthly sales forecast models template
A monthly sales forecast models template breaks down your projected sales activity at a suitably granular level. However, this doesn’t mean that the amount of information is compromised. Several years of projections can be displayed within a single document, allowing you to take in a broad swathe of information very easily.
When choosing a template like this, look out for one that can accommodate a product name, unit numbers, selling price, total sales, and the percentage of the total. Some templates can also combine raw numbers with a more intuitive presentation, like bar charts. They’re a great way of visualizing a key part of your business’s operation.
2. Annual budget expense forecast template
This template allows you to plan your future business operations in a more complex manner. You can, for example, look more closely at expenditure on salaries, supplies, and equipment across multiple sites simultaneously. You can also look ahead a short distance to see how your expenditure will be affected.
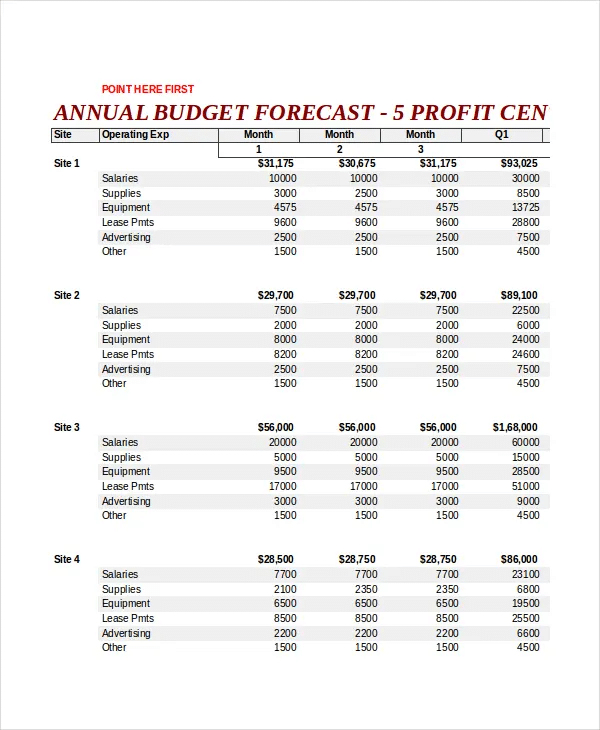
Templates like these are ideal for larger businesses with several different premises and expenses to think about. As such, they may be of less use to smaller enterprises.
If you’re worried about your expenditure, you can assemble a cash flow forecast to put your mind at ease.
3. Demand planning forecasting template
This template allows you to predict your company’s financial status by analyzing various different factors and build demand forecasting models in Excel. You might want to better understand your gross revenue (on a recurring or non-recurring basis) and break down your revenues from individual products. If you sell a range of products you want to track, this template is probably what you need.
We at Inventory Planner have produced our own sales forecasting Excel template for Shopify merchants.
Is your Shopify, Amazon, or other store growing?
Do you want to have better control over your inventory?
Do you want to forecast how much inventory you’ll need?
All of the above? Let us help.
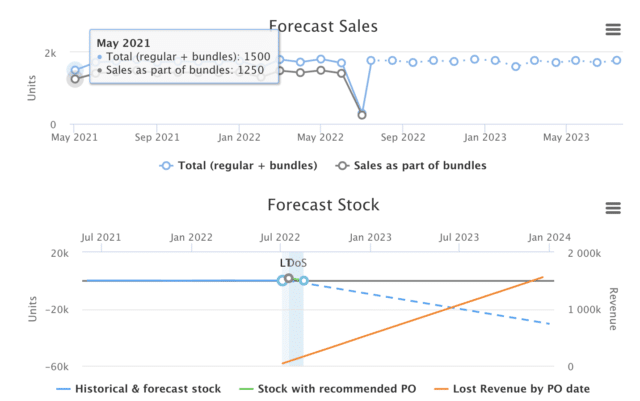
We’ve created a free demand forecasting Excel template for Shopify you can use to see:
- Forecasted sales and sales velocity
- How long your current stock will last
- How much you should order based on your lead time and days of stock
What to do:
- Follow the instructions on the “Overview” tab to copy over information from your e-commerce store file(s).
- Use the calculated replenishment recommendations to plan your inventory more effectively!
Inventory Planner Forecasting
You can make some tweaks to the exponential smoothing process after you’ve created the aforementioned worksheet. Besides changing when the forecast starts, you can change the length of a season pattern, fill in missing points, or (if you’re familiar with statistics) view smoothing coefficients.
Why choose dedicated forecasting software over Excel?
While Excel has extensive forecasting capabilities, there may be other tools that are more suited to the task nowadays. This is for the following reasons:
1. Fewer errors
Excel’s complexity means that it’s very easy to make mistakes in it. If, for instance, you paste values into the wrong cells, you can quickly break any forecasting framework you’ve constructed. More troublingly, you may not discover the error until long after it’s been made. This can put your business on a course it shouldn’t be on, with disastrous consequences.
As such, it’s important that you thoroughly understand Excel’s inner workings before you come to use it. But doing so for the purposes of forecasting may be pointless, considering the suitability of other tools.
2. Better decision-making
Another problem is that Excel only uses historical data and past trends, and you need to give it up-to-date information in order to give you a forecast to shape future actions. The long, arduous method of inputting data to Excel (or collecting it from other people) means that data can literally become outdated as you’re entering it.
Moreover, Excel is unable to track and adapt to real-time changes that you may wish to deploy. This means you may struggle to make an accurate forecast.
3. Streamline structures and processes
The more data you add to an Excel spreadsheet, the more difficult it will be to use it. Piling more and more data into one place can lead to the spreadsheet becoming slow or buggy. This then makes it difficult to interpret its information or retrieve records contained in it. Using a more specialized tool makes these key tasks easier to carry out—like reporting, which Inventory Planner excels at.
Inventory Planner: The superior forecasting method
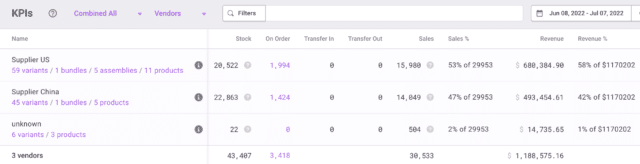
Inventory Planner integrates directly with over 30 e-commerce stores and Inventory Management Systems as a tool for demand forecasting, replenishment analysis, KPI reporting, and the creation of new stock orders through Purchase Orders, Warehouse Transfers, and Assembly Orders (for production). This means no manual data entry that is prone to errors, more sophisticated forecasting and more streamlined purchasing.
With Inventory Planner, you can;
- Customize forecasts based on seasonality, recent trends, category trends, bundle and assembly relationships, and much more
- Customize replenishment recommendations and alerts by warehouse, by SKU to order what’s needed at the right time.
- Customize reports using over 200 metrics and attributes.
Book your free interactive demo to see what we have to offer.