Inventory management: just seeing the two words together is enough to give most business owners a headache. But that doesn’t need to always be the way. There are a variety of tips and tricks you can use to help with your inventory management and one of these is to use the help of Microsoft Excel.
We’re going to take a look at how Excel can simplify your inventory management processes, cast our eye over some of the formulas that can help, and investigate a few free templates that can make the process even less painful.
Once we’ve done all that, we’ll take a look at some of the alternatives to Excel. There could even be better options available to help business owners revolutionize their inventory management.
But we’ll get to that later. First, let’s start with the basics. How exactly do you use Excel for inventory management?
What is inventory management?
Before attempting to utilize Microsoft Excel to manage your inventory, you should take the time to learn how to use the program. Having a good knowledge of how Excel works will make inventory tracking so much easier.
Before diving into Excel inventory features, let’s take a deeper look at inventory management first. Inventory management includes various aspects throughout the whole inventory purchasing to selling process. So when it comes to inventory management, it can be broken down to two major areas:
1.Inventory forecasting and planning:
this process is critical to ensure the right amount of the right products will arrive in the right inventory location. So you can avoid a substantial amount of inventory issues once it’s in the warehouses, such as endless warehouse transfers, out-of-stocks or overstock. if forecasting and planning inventory is your main goal, you need different Excel spreadsheets as you actually need formulas to predict future sales and customer demand. Check out this complete guide of how to use Excel to forecast demand and plan inventory.
2. Inventory control:
once inventory has arrived in your warehouses, you need full visibility of your inventory – how much inventory you can sell, how much is on order, how much inventory is damaged, where each item is located, how different items are performing… So you need Excel to keep track of all your inventory. In this article, we’ll focus on the second scenario – how to use Excel for inventory control. Here are the basic steps you should follow that even beginners can get to grips with.
Want to adopt a more reliable, automated way to forecast and purchase inventory?
How to use Excel for inventory management
1. Identify what needs to be monitored
The first step you need to take, before even opening up Excel, is to decide exactly what you want to track.
- Product location
- Product cost
- Product quantity
- Product name
- Inventory value
- Inventory descriptions
- SKUs
Having different fields will make it easier for you to filter and search for specific items, so keeping detailed records is a great idea that will pay dividends later on.
2. Create a spreadsheet
Once you’ve decided which fields you’re going to keep track of, it’s time to actually create your inventory spreadsheet. There are two ways to do this: you can create a custom document from scratch or you can personalize an existing spreadsheet template.
Creating a custom spreadsheet will allow you to lay out your spreadsheet in an tailored and easy-to-understand way for all your employees. However, if you’re new to Excel, you may find that starting with a template will significantly reduce the time it takes to get your spreadsheet up and running.
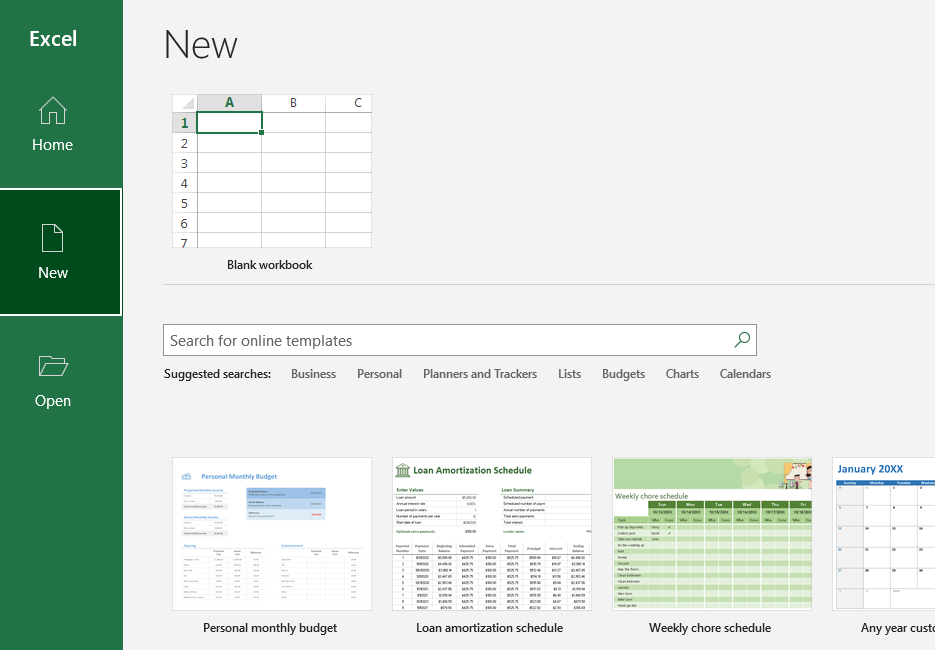
If you wish to use a template, open a new document in Excel by clicking on “File” and then “New”. The window that appears should have an option to view “More Templates”. Click on this, and then use the search bar in the top right of the page to look for inventory templates. You can then take a look at the templates available to you and choose the one that best works for you.
3. Enter the required fields
Now that you’ve set up your spreadsheet or chosen your template, you can begin to input the fields that are specific to your business. When using a template, this is an essential step to ensure that the finished spreadsheet reflects your organization’s needs and isn’t just a generic spreadsheet.
A good idea is to organize your fields by importance. You can input these by putting the most searched for or filtered by options at the top and then list them in decreasing importance as you go. For example, SKUs are unique to each product, so listing them first will allow you to easily find the products you’re searching for.
If you have a large number of products to catalog, you may wish to divide your spreadsheet up across multiple tabs. You can see tabs displayed across the bottom of the worksheet and can add new ones by clicking on the “+” icon on the rightmost tab.
If you’re running an e-commerce site for clothing, you could have a separate tab for product categories such as shirts, shoes, underwear, etc. You can label the tabs so that you can easily differentiate between them. Then you can navigate to the right tab, eliminating the need for excessive filtering when searching.
4. Input the product details
Once your categories are established, it’s time to start inputting your product details. You should do this carefully to ensure no mistakes are made. This is especially important in fields for SKUs or barcodes.
You may find that you need to change the categories you have used or alter the way they are arranged, once you begin inputting information. This is especially likely to happen if you’ve designed your own spreadsheet from scratch.
Don’t panic if this is the case! It’s better to tweak your spreadsheet as you go along so that you wind up with a finished product that works effectively and efficiently.
5. Update the document
Once you have completed your spreadsheet, you need to make sure it’s regularly updated. This includes updating stock levels after sales are made, adding new products as they come into stock, and deleting old lines that are discontinued.
The whole point of the spreadsheet is to help you keep on top of your inventory and you can’t do that if your records aren’t a true reflection of what’s in your warehouse. Make sure your teams know who is responsible for updating the spreadsheet and ensure it’s done regularly.
Factors for choosing an Excel inventory management template
There are many inventory management templates available for Excel, which just helps to prove how popular the platform has become for inventory management. Not all templates will be appropriate for your business, however.
It’s important to choose a template that works for your organization, offering you a way to track all your key metrics, without taking up space with a load that you won’t ever use. Here are just a few of the criteria you should consider when choosing which template to use.
Simple and concise
Using Excel for your inventory management is supposed to make the process simpler for you, so it’s important you choose a template that’s easy to use. Otherwise, any time you save on inventory management will be spent on training your teams to use your new platform.
Ensuring your inventory management template is simple and concise will help you save time, while still giving you all the features you need to revolutionize your inventorying.
Scalable and adjustable
Of all the aspects of a business, inventory is possibly one of the most changeable. Stock levels and product choices are constantly changing, so your inventory management template needs to be easily adjustable, so you’re always kept up to date.
Choosing a template that allows for quick adjustments is therefore paramount. You need to be able to do this without having to restructure your entire spreadsheet. This will ensure you always have the most accurate and current information at your fingertips.
Streamline analysis
The analytics capabilities of your inventory management template will dictate how easily you can forecast your future inventory needs. It’s therefore imperative that you choose a template with streamlined analytics so that your predictions can be accurate and up to date.
Being able to easily access data about individual product availability, historic sales data, and future purchase orders will allow you to make predictions quickly and easily about your inventory requirements, meaning you can place orders for when they’ll be needed and not before.
4 free Excel templates for inventory management
There are many inventory management templates for Excel offered by a whole host of third parties. Now that you have a rough idea of the type of template you should be looking for, it’s time to consider your options. Here are four examples that you can use free of charge:
1. Intuit Quickbooks Excel inventory template
The Intuit Quickbooks Excel Inventory Template comes with great tips and features to help you manage your inventory.
You can easily manage your purchase orders, which allows you to keep track of all your products, what stock you’ve got on hand, and the total value of your inventory.
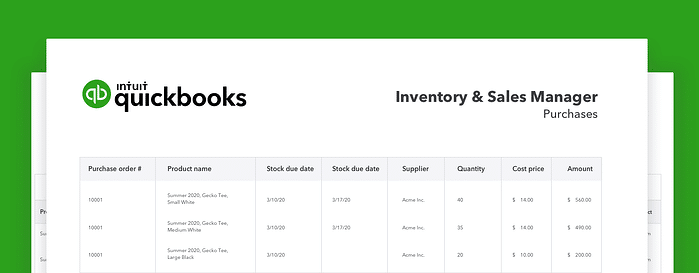
Not only does it allow you to track your stock, sales, and orders, but it also gives you the ability to present your data in reports generated from a dashboard inside the workbook itself.
You’ll be able to see your fulfilled orders at a glance and identify which of your products are best-sellers, which is a great help when it comes to placing new orders from suppliers.
Integrate Inventory Planner with QuickBooks
2. Zervant inventory and stock management template
Zervant’s free inventory management template provides a great starting point for small businesses or startups that may have never used Excel to track their stock before.
It features three key tabs that give you everything you need to quickly and easily manage your inventory: daily stocktake, stock inventory, and stock database.
The daily stocktake tab keeps track of stock moving in and out of your warehouse, giving you an up-to-date picture of what inventory you have on hand.
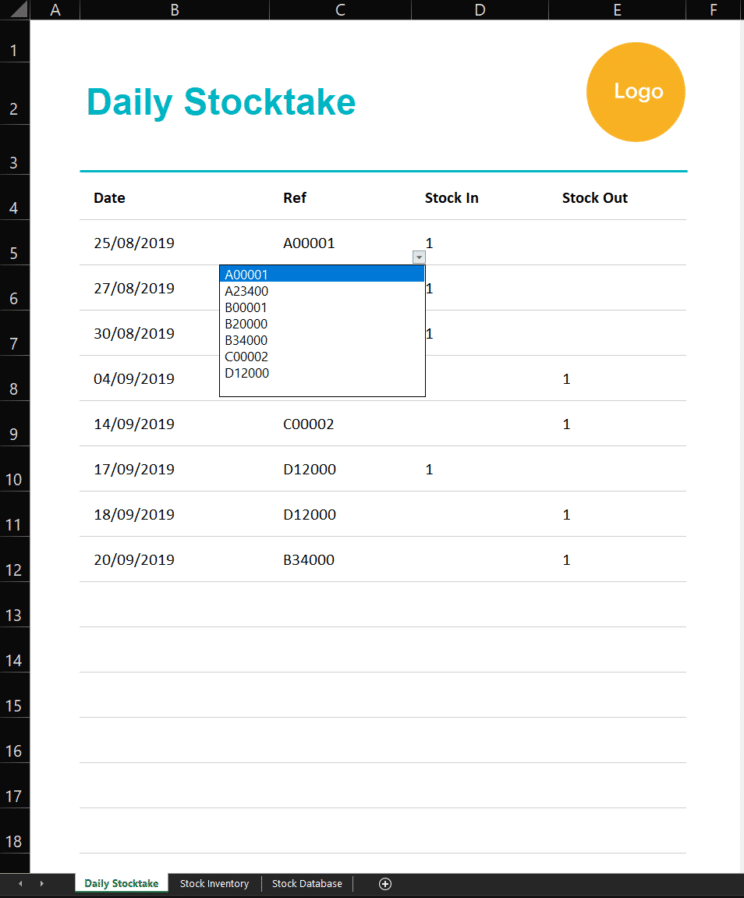
The stock inventory tab uses formulas to calculate your stock at the close of business each day. By using the opening stock and stock movement data from the daily stocktake tab, you can track trends in stock movement across longer periods of time.
Finally, the stock database tab gives you an inventory list or a place to keep a running check of all the individual product lines you stock. Adding a line here will automatically create an entry for it in the stock inventory and daily stocktake tabs.
You can even incorporate the use of barcode scanning apps to add new stock lines to your database, so it can all be managed easily from your smartphone. This is a great feature for small and medium-sized businesses that may not yet have invested in specialized tools.
3. Excel Champs inventory management template
Excel Champs offers a free version of their inventory tracking template which still has a lot to offer. Features such as invoice generation are exclusive to the paid pro version, however.
One of the most notable features is the dashboard tab, which automatically updates as new data is added to the spreadsheet. This dashboard gives you all the important information you need to know at a glance, such as your stock value, stock in, and stock out.
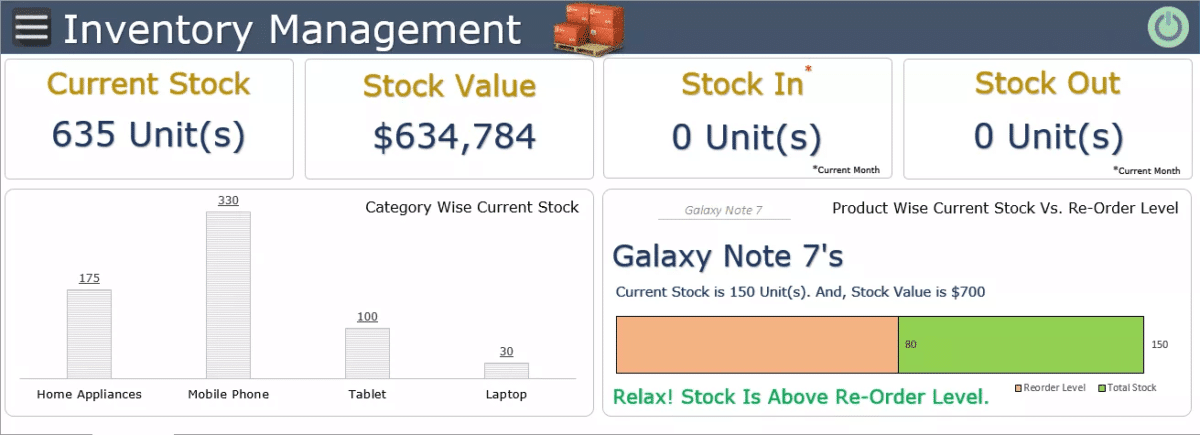
The dashboard is updated as new information is added to the user forms. These have been optimized so that minimum data entry is required, making it quick and simple to input new data.
There are forms for entering new products to keep track of stock coming in and to monitor stock going out. Datasheets keep track of the compiled user forms as they are entered, so you can see an entire database with the data you’ve entered and search for entries by their unique serial number.
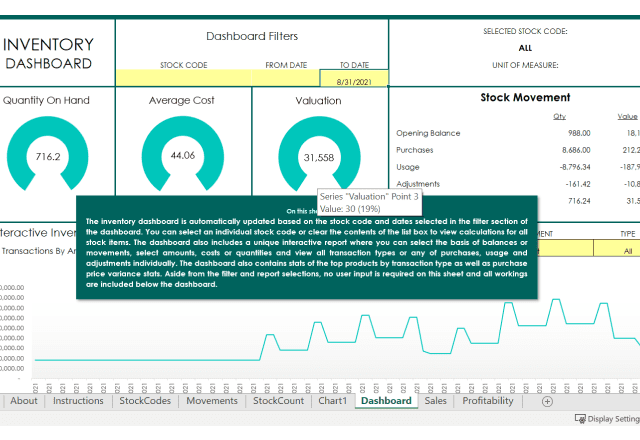
4. Excel Skills’ inventory template
Excel Skills offers a wide variety of templates for Excel for everything from assets to payroll and vacation records. They offer three different options for managing inventory processes.
Unlike the other choices listed here, these templates aren’t free, but they do offer free trial versions so you can try before you buy.
There’s an inventory control template, which allows you to compare sales to your inventory usage, allowing you to analyze profitability.
There’s also an inventory quantity control template which is more focused on keeping accurate records about stock in and stock out. It also allows you to refer back to stock levels at specified dates.
Finally, there’s a trade-based template that allows you to calculate the gross profit margins of all inventory items.
All three templates come with access to an inventory dashboard so that you can see up-to-date representations of all the data that’s been input quickly and easily.
10 Common Excel inventory management formulas
Using Excel to manage your inventory can be a daunting experience, especially if you’re a first-time user. Thankfully, there are a plethora of Excel formulas that can make the process a whole lot easier.
These formulas provide shortcuts for everything from finding and combining data to analyzing and drawing conclusions from it. Here are just a few of the most common formulas that you’re likely to come across:
SUM
The SUM formula is one of the most basic available to you in Excel. It is used to add values in two or more cells. It can be used to keep a running total of values such as sales totals without having to manually add your sales together.
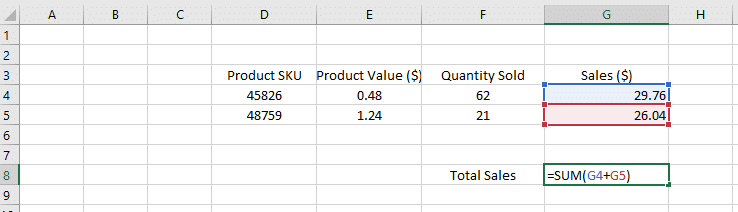
In the example above, the SUM function is used to add together the sales totals of the different products in an inventory, showing the total daily sales across both products.
It can also be used to multiply the values of two cells. In this instance, the formula would instead read:
=SUM(E4*F4)
This calculation would then give you the value displayed in cell G4, the value of the Sales ($).
SUMIF
SUMIF is a slightly more sophisticated variation on the SUM formula. It allows you to only add together values that meet certain criteria. For example, you could choose to only use cells in your calculation that refer to a specific product category or only the sales for a specific customer demographic.
This requires data to be categorized into these criteria, so the more categories your spreadsheet contains, the more options for customized formulas you will have.
The SUMIF formula is as follows:
=SUMIF(RANGE,CRITERIA[sum_range])
RANK
Using the RANK formula allows you to rank items, using criteria such as sales quantity, incoming stock or existing inventory. This allows you to easily see your most popular lines and to determine which may need to be replenished most urgently.
RANK functions almost the same as the Sort function, apart from the fact that it automatically ranks your data, whereas Sort only functions when you specifically tell Excel to do so. This means you can set up a spreadsheet to automatically display the rank of your products at all times.
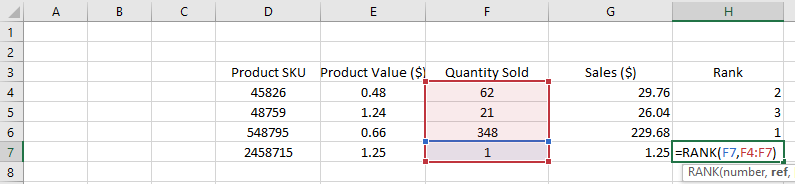
As you can see from the example above, the RANK formula is as follows:
=RANK(cell,cell:cell)
The first cell is the number to rank and the second and third cells are the values that it is to be ranked against. In the above example, the quantity sold value is being ranked from highest to lowest, so the product with the highest sales is ranked number 1.
You also have the option to add an order to the formula so that it would read as follows:
=RANK(numer,ref,[order])
This simply tells Excel whether to sort the values in ascending or descending order.
DAYS
This formula is used to calculate the number of days between the dates displayed in certain cells. This is useful for calculating how long products have been in your warehouse and could be essential if you’re stocking products that have a short shelf life.
The formula is as follows:
=DAYS(cell,cell)
There is a complementary formula that can be used to calculate only the working days between two dates, which is useful for ascertaining when new stock orders need to be placed in order to have products ready for your customers. That formula reads:
=NETWORKDAYS(cell,cell,[numberofholidays])
COUNTA
One of the biggest problems facing any inventory management spreadsheet is data omission. Missing entries in product catalogs can throw off the whole spreadsheet and seriously skew the data you’re presented with.
Luckily, there is a formula to help you identify any empty cells. Using COUNTA will give you a total of the values entered in a range of cells. This means if the total is less than the number of entries you have, you know that some data is missing.
The COUNTA formula is:
=COUNTA(cell:cell)
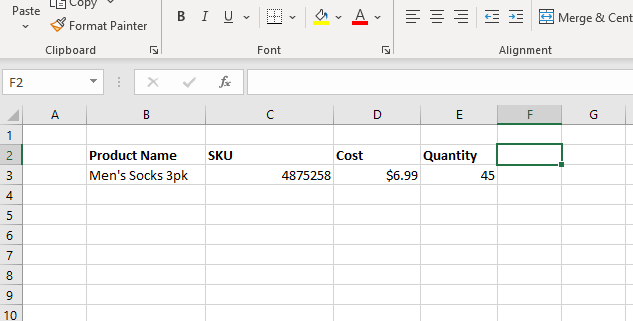
VLOOKUP
VLOOKUP is short for “vertical lookup” and is a function which allows you to search for a value in your spreadsheet and return it in a new cell. The VLOOKUP formula is as follows:
=VLOOKUP(cell,table array,column index,false or true)
This formula is quite complicated, so let’s break it down. The “cell” is the information you want to look up. The “table array” is the range of cells in which you’re searching for the information.
“Column index” refers to the specific column in which the desired data can be found. And “false or true” allows you to enter 0 (“false”) if you’re only looking for an exact match or 1(“true”) if you’re looking for an approximate match.
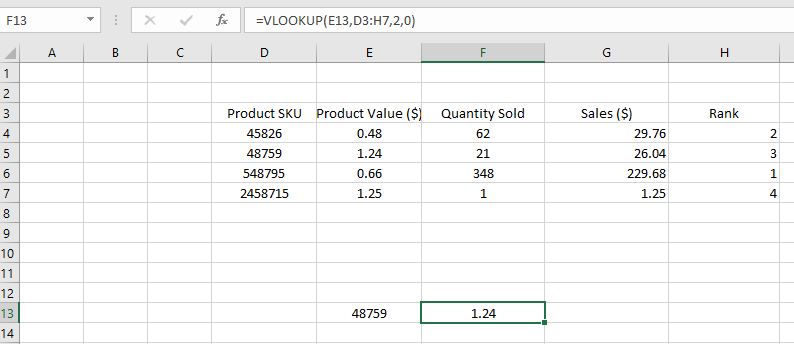
In the example above, we want to search for the value of the product with the SKU 48759, so the formula reads:
=VLOOKUP(E13,D3:H7,2,0)
COUNTIF
COUNTIF works similarly to COUNTA, although it differs in that it only counts cells that meet specific criteria. The formula reads:
=COUNTIF(range, “criteria”)
So, if you wanted to only count entries that contained a unit price of $0.66, the formula would be:
=COUNTIF(D3:H7,“0.66)
Or
=COUNTIF(D3:H7,E6)
AVERAGEIF
The AVERAGE function in Excel allows you to calculate the average of a range of cells containing numbers. This can be used to easily obtain the average sales for any given day or to see the average amount of stock that’s leaving the warehouse.
The AVERAGEIF function is similar, but it only calculates the average of the cells that meet your specified criteria. For example, you could calculate the average sales of a particular product category, rather than your entire inventory. This also allows you to eliminate outliers, making your results more accurate.
The AVERAGEIF formula is:
=AVERAGEIF(range, criteria, [average range])
The “range” is the range of cells you wish to average, and the “criteria” is which selection of cells within that range you wish to use in your calculation. The “[average range]” is optional, it allows you to select exactly which cells to use when calculating the average. If it is omitted, then the “range” value is used.
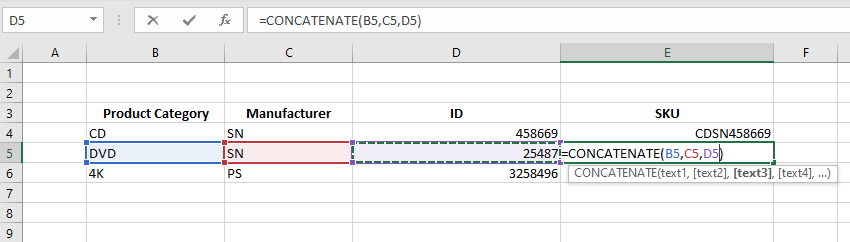
CONCATENATE
The CONCATENATE function allows you to combine different types of data from multiple cells into one cell. In terms of inventory management in Excel, it’s often used to generate SKUs.
The formula is as follows:
=CONCATENATE(text1, text2)
You can keep adding cells to the formula depending on how many values you wish to combine. Excel supports the combination of up to 255 cells, should you require that many!
MAXIF and MINIF
The MAXIFs and MINIFs formulas will show you the maximum and minimum values from a specified set of values, respectively.
These formulas are useful for finding which products have generated the largest volume of sales in a given day or week or which of your items have the lowest purchase point.
The MAXIFs formula is:
=MAXIFS(max_range, range1, criteria1, [range2], [criteria2]…)
And the MINIFS formula is, similarly:
=MINIFS(max_range, range1, criteria1, [range2], [criteria2]…)
The “max_range” is the range of values from which you wish to find the maximum or minimum value. “Range1” is the first range to evaluate and “criteria1” is the first set of criteria to apply to “range1”. You can continue adding other ranges and criteria to search within, (“[range2]” and “[criteria2]” etc.), as required.
Inventory management in Excel: best practices
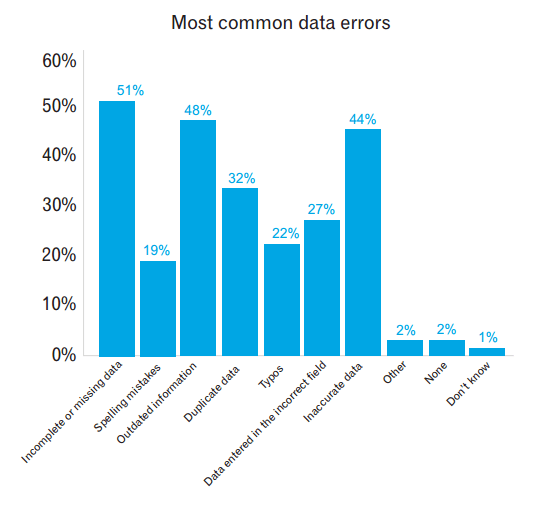
Unfortunately, human errors do occur when manually inputting information into a spreadsheet, so you should ensure that your employees are trained to self-audit and look for errors that could compromise the reliability of your inventory management spreadsheet.
Alongside self-auditing, here are a few more top tips for how to ensure your inventory management in Excel runs smoothly.
Update Excel spreadsheets as often as possible
The key to ensuring your inventory is current and accurate is to update your Excel spreadsheet as often as possible. While you can automate some processes in Excel by using formulas, they still require manually inputted data to work.
This means that the only way your inventory management spreadsheet in Excel accurately reflects your actual inventory is to ensure it’s updated regularly. You should make sure that all employees know whose responsibility it is to update the spreadsheet and that they know to do it as quickly as possible once a new order is dispatched or when new stock is received.
This is the best way to ensure that products don’t go out of stock, are not oversold, and that orders from suppliers are placed promptly.
Opt for cloud-based version of Excel
Spreadsheets in the traditional, offline Excel program are severely limited in that only one person can access and update the information at once. This makes keeping the spreadsheet up to date a laborious and time-consuming task.
Opting for a version that is kept in the cloud by using the OneDrive version of Excel or an alternative such as Google Sheets, is a great way to eliminate these problems. This means that multiple employees can access the spreadsheet at once and changes can be seen by everybody in real time.
Not only that, but it gives employees a better chance of identifying mistakes in the spreadsheet, reducing the risk of them being missed and providing inaccurate data and results further down the line.
Another benefit of using a spreadsheet in the cloud is that it is automatically backed up, meaning that if anything happens to the device it’s being accessed on, the entire spreadsheet won’t be lost but can be accessed on another device.
It also means that the spreadsheet is constantly up to date across whichever platforms it is accessed, so employees anywhere in the world can check inventory levels and sales totals, and place orders confidently.
Make time for centralized data analysis
One of the biggest problems with using Excel for inventory management is that it can be difficult to analyze your historical data, especially if your spreadsheet is ongoing and contains data gathered over a long period.
One way you can combat this is to consolidate your data at regular intervals. This could be done, weekly, monthly, quarterly, or all three. Taking time to analyze data gathered over a set time period and present it in graphs or tables will give you a chance to better reflect on your performance.
You could even pay special attention to significant periods in the retail calendar such as the holidays or during a big sales event. This will allow you to draw conclusions about your performance year-on-year and whether or not you’re achieving your KPIs.
This will also help you with inventory management, as you’ll be able to see at a glance how you have performed, which lines are best sellers and which products are in danger of going out of stock and will need replenishment.
You can create pivot tables natively within Excel and then display them in your spreadsheets to provide this analysis.
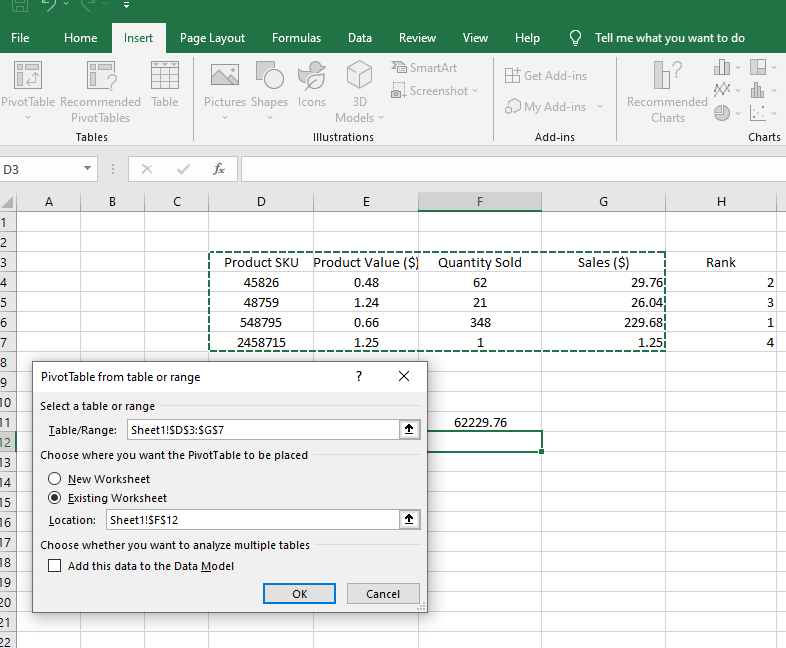
To create a pivot table, navigate to the “Insert” tab and select “PivotTable”. Then choose “From Table/Range” to create a table from your active spreadsheet.
In the dialog box that appears, select the range of data you wish to create your table from. Choose whether to display the table in the current Excel sheet or in a new one. Finally, click “OK” and your table will be generated. You can customize it as required.
Always double-check your data
Excel provides a great platform for keeping track of your data, but it requires you to manually track and calculate the information that has been inputted. This means that you need to be fastidious about how information is entered and constantly vigilant to pick up on any mistakes that may have been made.
It also means that you need to be aware of outside factors that will affect how the information is used. This could mean making sure you account for lead times when reordering stock, whether or not tax is calculated within your sales totals, and whether your inventory value is calculated on purchase cost or resale value.
The odd spelling mistake in an item name is unlikely to have disastrous results, but an extra digit added or removed from a stock total can quickly derail supply chains. It can’t be overstated how important it is to be vigilant about mistakes in your spreadsheets.
Understand when you need to upgrade to a better solution
As much as we’ve talked about the benefits of using Excel for your inventory management, there are also drawbacks. We’ll investigate some of these in the next section and it’s important that you remain mindful of them when deciding how to carry out your inventory management.
The larger your inventory, the more unwieldy an Excel spreadsheet becomes. Keeping track of hundreds or thousands of rows and columns is a mammoth task, and the more entries you have, the more likely it is that mistakes will occur, especially when a lot of the data will need formatting.
It is therefore generally a wise approach for medium and large scale businesses to find more suitable alternative for their inventory management.
If you’re thinking of upgrading, there is a large array of inventory management solutions available. These are specially designed with inventory management in mind and offer all the benefits of using an Excel spreadsheet with many more besides, without any of the significant drawbacks.
Advantages of inventory management software over Excel
As your business grows, you may increasingly notice the need for a dedicated inventory management system, rather than simply relying on an Excel spreadsheet. There are a variety of examples of inventory management software and inventory management apps available.
There are several advantages to using one of these over Excel, the most beneficial of which we’ll examine here.
Higher accuracy with more sophisticated algorithms
Using dedicated inventory software allows you to more accurately track your incoming and outgoing stock from a variety of sales channels and across different warehouses.
This is because the software is built from the ground up with this purpose in mind, so the algorithms are much more sophisticated. With Excel, you’re having to bend the existing formulas to serve your needs, which can’t always be accomplished with total accuracy.
Greater accuracy in your inventory databases means that you have a better representation of exactly what stock is in your possession and how much is being shifted. This means that any conclusions you draw on your production, sales, marketing, purchase orders etc. will all be more reliable and meaningful.
Time and cost-efficient
The bigger your business, the bigger your inventory management spreadsheet will need to be. So, for larger businesses, trying to constantly update a spreadsheet with thousands upon thousands of entries becomes a time-consuming task.
By using barcode scanners and similar inventory management procedures, inventory management software dramatically reduces the time needed to track incoming and outgoing stock. Not only does it save time, but it also reduces the manpower needed to keep the database updated, saving you money, too.
But that’s not all. Automations can be utilized to track incoming customer orders and create purchase orders, saving you even more time. Automated entry also reduces the risk of mistakes in your database, meaning you can spend less time scouring your spreadsheets for human errors.
Simple navigation to different channels
Using dedicated inventory management software also makes multichannel coordination much easier. If you’re an expanding business, it’s entirely possible that you may be selling your products through several different channels; your own e-commerce site, affiliate sites, and online marketplaces to name but a few.
In an Excel spreadsheet, keeping track of all these different sales channels would quickly become a nightmare. With inventory management software, however, the task couldn’t be simpler. It has the capacity to monitor outgoing stock through multiple channels with ease.
This is done through a combination of sophisticated, specialized algorithms, and integrations with your existing management solutions. This means that purchases are automatically tracked, and goods are deducted from your inventory, regardless of where the order originated.
Limitations of inventory management in Excel
While using Excel for inventory management is a cheap solution for smaller businesses, there are several drawbacks that may make it unsuitable for expanding businesses.
Excel can be error-prone
Firstly, there is the aforementioned risk of data entry errors. It is hard to completely eliminate the human error aspect from any task and because Excel spreadsheets require information to be input manually, this is a prominent problem.
As you’d expect, this problem only gets bigger as the size of an organization’s inventory increases. A dedicated inventory management platform gives you the ability to quickly and reliably input data and track sales across multiple channels.
Limited access to Excel spreadsheets
Another factor to consider is the limited access available in Excel. Only one employee can update the spreadsheet at a time, which can cause problems when multiple employees need to input new data.
This problem is mitigated somewhat through the use of a cloud version of Excel, but the solution is rarely as elegant as those presented by the automation of dedicated inventory management software.
Lack of visibility in Excel
Excel spreadsheets also limit your ability to easily view historical data. There are analysis tools such as pivot tables available, but they are often time consuming to produce once you’ve sifted through all the data available to you. More advanced solutions like Inventory Planner provide more granular analysis much more quickly.
Dependence on one person’s expertise
Another issue is the inventory management Excel spreadsheet is usually built by one person in a company who is knowledgeable about Excel and inventory management basics. This means it’s very dependent on the person’s expertise and may be challenging for another person to take over. It could be an issue from a hiring perspective.
Excel can have a steep learning curve
Although there are lots of free spreadsheets available, you may still need to make significant adjustments for the spreadsheets to suit your own business needs. So the learning curve can be deep and it can take time for you to do tests and make adjustments.
Switch to Inventory Planner to have better visibility of your inventory in Excel
Inventory Planner doesn’t just predict sales and gives inventory purchasing recommendations. It also provides an intuitive reporting functionality, which provides you in-depth insights on your inventory performance. You can easily identify your top-sellers, slow-moving products, items that are draining your cash or inventory that has been sitting there for too long.
So what are you waiting for? See how Inventory Planner can help your business. Get your interactive demo