Running a successful business in the retail sector involves closely analyzing various aspects of your business. This could be through the use of a monthly, weekly, or daily sales report, stock report, and inventory report, among other things.
Paying close attention to your stock in order to successfully fulfill customer orders is vital—that’s why understanding everything there is to know about an inventory report is crucial.
We’ll get into what an inventory report is and how to create one shortly. First, it’s important to establish that it’s tied to a lot of other aspects of your business. From future predictions like holiday sales forecasting to organizational concerns like deciding which products to focus on in your marketing, inventory reports can factor into a lot of your daily retail workflows.
With that said, let’s kick things off with a definition of inventory reports.
What is an inventory report?
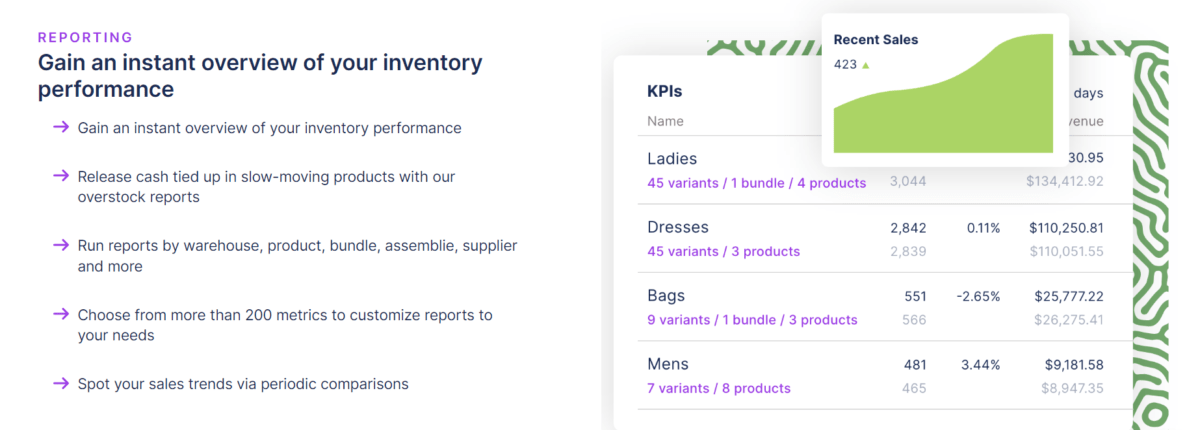
Put briefly, an inventory report provides insights into the status of your stock, letting you know when you need to reorder certain items.
Any good inventory report template should provide business owners with details about which items are currently available in stock, which stock items need to be replenished, and how each item is performing in terms of sales. This information might be presented in any number of ways depending on the retailer’s preferences and priorities.
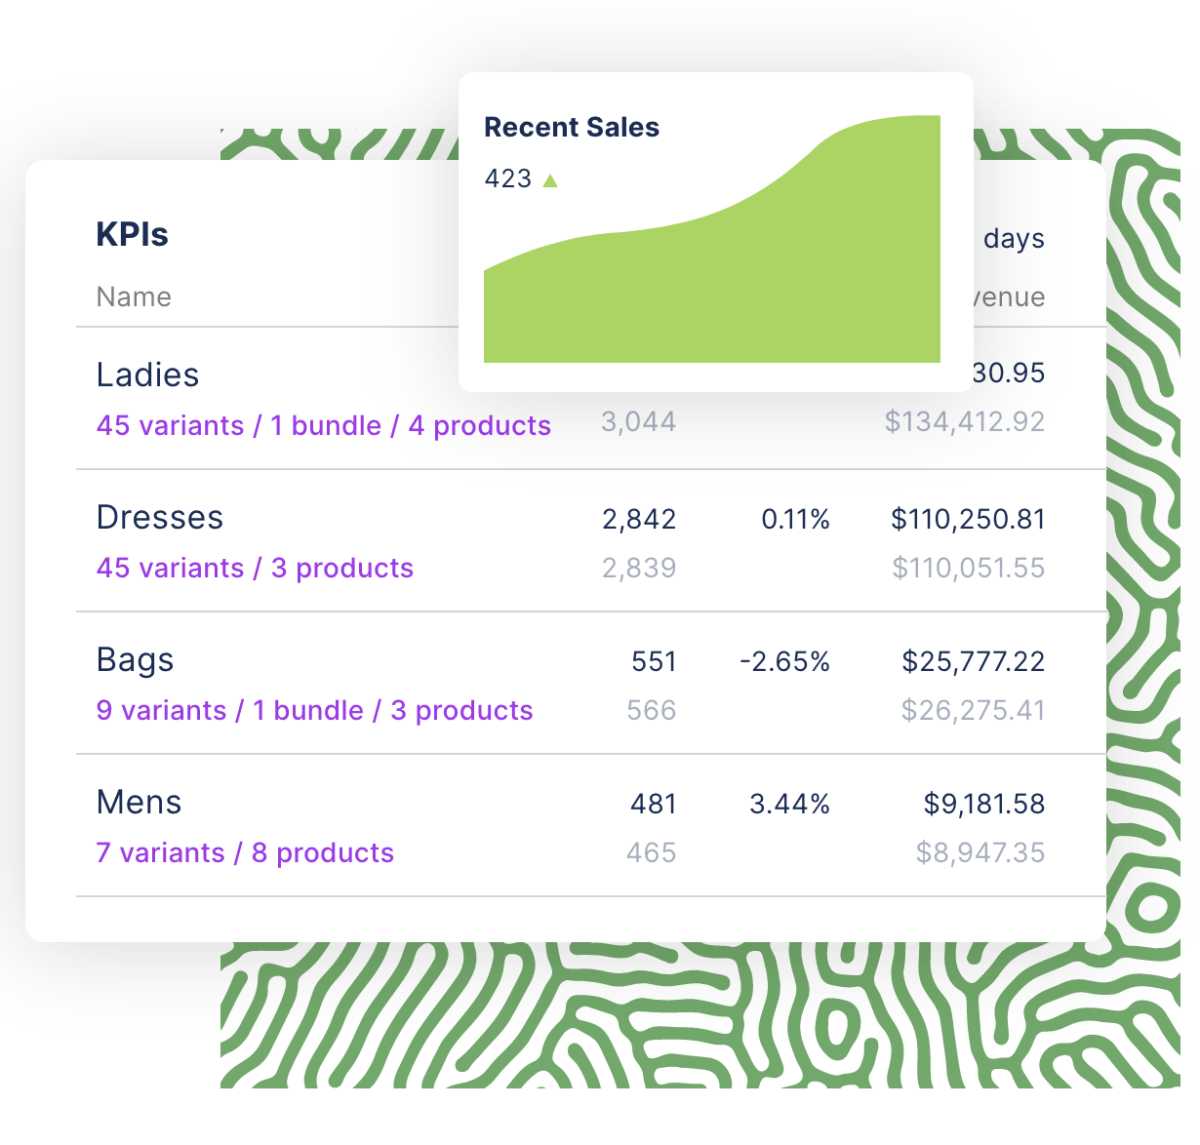
Inventory reports come in many forms. Some people might prefer bulleted lists, while others gravitate towards more visual representations like graphs and charts.
A great inventory report template in Excel will let you combine these presentation styles into a comprehensive report that’s both easy to scan and highly detailed.
Want to see how Inventory Planner can transform your business
What is an Inventory Management Report?
So, an inventory report focuses on your stock, but what’s an inventory management report, and how is it different from an inventory report?
The short answer is that inventory management is about more than just knowing what you’ve got in the stockroom.
In other words, all inventory management reports are also inventory reports, while the reverse isn’t true.
If your report merely gives you the details of which items your business has in stock and in what quantities by tracking each item by its SKU or barcode, for example, it would be considered an inventory report.
On the other hand, reports that go into detail about which items perform best, what the reorder point of each stock item is, and similar topics count as inventory management reports since they help you manage your stock rather than just track it.
Types of inventory management report
There are a few approaches you can take to inventory management reporting. An inventory management report can be done manually, or you can use inventory management apps or inventory management software, like the software offered by QuickBooks, to automate your reports.
Automated reports help avoid discrepancies that could be caused by human error. They can also provide real-time data, such as when they’re integrated with your POS system.
The following five categories of inventory management reports are the most common—though some reports might be a combination of two or more variants of inventory management reports.
Aging analysis
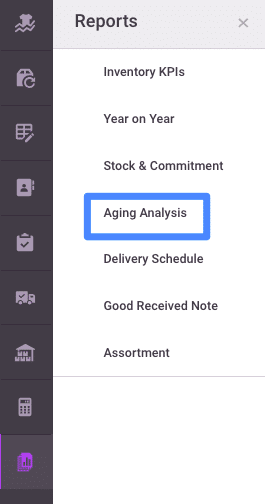
When new stock arrives, it’s important to know how much time it’s likely to take before an item leaves your business’s possession via a sale.
That’s what aging analysis reports aim to do.
By focusing on showing you how quickly your stock moves, aging analysis reports show you how long an item should take to go from one place to the next. For example, if your stock arrives at your warehouse and then typically leaves the warehouse within a month, an aging analysis report would indicate this.
These reports help to determine whether you’re staying on top of your inventory movement.
If your items are selling more quickly than usual, an aging analysis will flag this up. At the same time, if some stock has been languishing in the warehouse for too long, your aging reports will highlight this fact so you can figure out the cause of the problem.
Average inventory report
So you need to know how much stock is available, on average, during a given time period. That’s what an average inventory report helps you figure out.
Understanding fluctuations in stock availability is much easier when you regularly create average inventory reports. This helps with planning and provides vital data to support marketing decisions.
Inventory turnover
Another type of inventory report that forms a key part of inventory planning is an inventory turnover report.
These focus on determining the exact details of when, where, and how your inventory stock changes hands. They tell you things like how much time it takes for an item to be sold after arriving in a store or when a particular item is sold out.
Inventory turnover reports are vital to anyone looking to understand the facts behind the movement of your inventory, and they help you keep the supply chain moving.
Inventory valuation
You need to know how much your inventory is worth so you can create accurate predictions and ensure you’re boosting your bottom line appropriately. That’s why inventory valuation reports are necessary; they let you gauge the monetary value of your inventory at specific times or during specific periods.
Purchase order value report
Not every customer has the same shopping cart, and, as a result, there’s a lot of variety among 9the total value of the orders that get placed with your business.
A purchase order value report provides some very useful insights. For example, you might want to know what your average order value (AOV) is or how this compares to your median value. This report pulls out these statistics to help you better understand your customers’ shopping habits.
Inventory Report Examples and Templates
We’re going to go through some inventory report examples so you can get a better idea of what a sample inventory report might look like.
From inventory reports in Excel spreadsheets to audit reports, there are a lot of shapes that an inventory report can take. That’s why we’ll be focusing on the most common types below.
Monthly inventory report
A daily report can be excessive for the kinds of insights an inventory report should give you. That’s why a monthly inventory report is the best way to go.
Along with inventory reporting metrics like carrying costs and cost of goods sold, which help with budgeting, a monthly report will help you analyze things such as overall performance—including stock in-hand and turnover.
This allows you to plan your future procurement and sales activities. It really is a great barometer of your business’s performance.
Inventory audit report
Essentially, inventory audit reports provide an accurate snapshot of the status of your inventory as a whole and each item individually.
They allow you to analyze your best-performing and worst-performing products so you can make demand-led purchasing decisions. What’s more, inventory data allows you to quickly identify overstocked or slow-moving items so you can adjust your marketing efforts to deliver maximum results.
Product inventory usage report
Your inventory is going to see a lot of use, particularly if you’ve got more than one store or warehouse location. From customers placing orders online to restocking inventory items for in-person stores, product inventory is often on the move.
To make sure you’re always aware of your product inventory usage across all locations affiliated with your business, you’ll want to make sure you’re using a product inventory usage report.
This kind of report makes it easier to merge information across platforms, which, in turn, creates a more unified approach to data analysis based on your inventory.
Performance inventory report
If you’re looking for a report that will show which of your products perform the best with your customers, look no further.
Performance inventory reports give you a clear idea of which products are popular, which is highly useful when you’re trying to figure out the quantities of stock you need.
Items that are bought with greater frequency need to be stocked in greater quantities and replenished more often—so the sooner you’re aware of an item’s popularity, the easier it is to take the right action to meet this demand.
Manufacturers’ inventory report
Every business in the retail sector, whether it’s a small business or a large business or an e-commerce store or an in-person store, relies on manufacturers that create their products. That’s why it’s essential for manufacturers to have access to regular, accurate reports that keep them updated on the status of their stock.
If a manufacturer is at risk of running out of a particular item or component, the retailers that are counting on being able to use that item need to know as soon as possible. This protects the reputation of the manufacturers since they’ll become known for always keeping their customers in the loop.
Inventory report summary
Sometimes, what you need isn’t a super in-depth report that answers every single complex question you could possibly come up with. You may simply want to view information like your total inventory level to avoid stockouts. For those occasions, an inventory report summary is just the right thing.
You’ll want to use summaries to give quick overviews of the state of your inventory. They exist to give at-a-glance information to anyone who needs it—after all, it’s not always possible or relevant to carry out an in-depth analysis.
How to Create an Inventory Report
Now that we’ve gone through the kinds of inventory reports that are available to you, it’s time to figure out how to actually report inventory.
This section will walk you through creating an inventory report from scratch in just six easy steps.
Of course, you might want to adjust your process along the way if you’ve got a very clear idea of the specific report you want to end up with, but these are basic guidelines you can always use as a frame of reference.
Make a column for the items and their descriptions
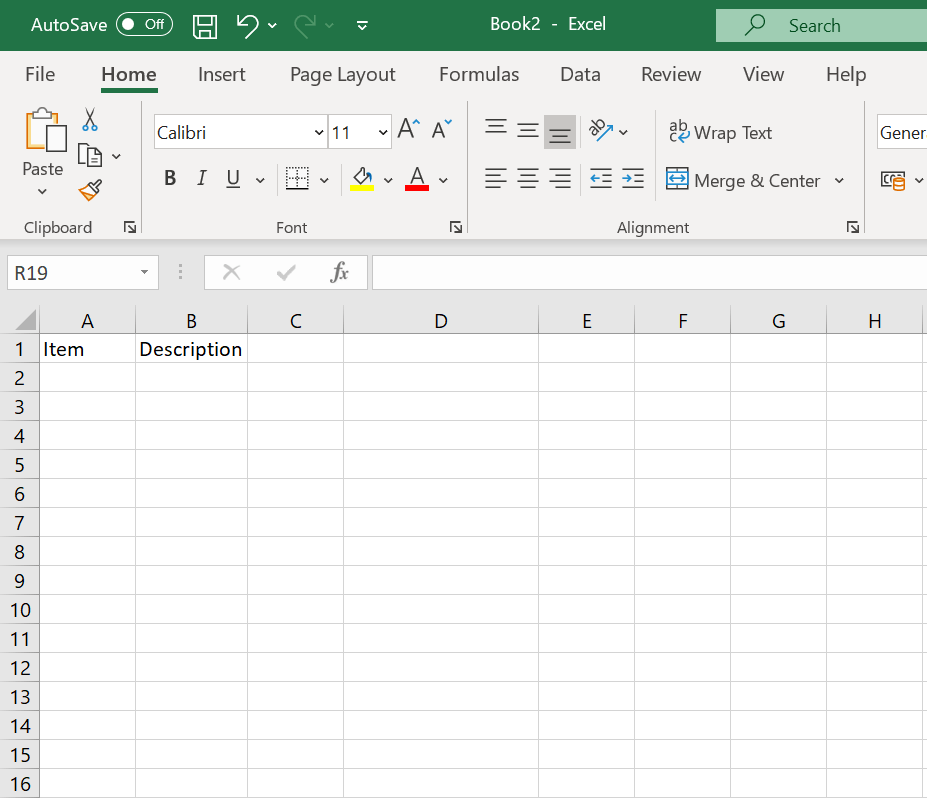
This is very easy to do in software like Excel, though text-based applications like Word or its open-source equivalents can get the job done as well.
Begin by creating two columns: one for the items in stock and one for a brief description of each item. You might choose to list each item by the name you sell it under, or you could use its item code.
The important thing is to ensure you’re consistent. If one description is three sentences long, the others should be around the same length. Also, major details like replenishment priority are generally best given their own columns for easier understanding.
Put a price on each item

This should be another separate column, formatted into whichever currency you work with.
If you’re a multinational retailer that operates in multiple countries with different currencies, it’s a good idea to make sure you’ve listed everything in one single currency in your report to reduce confusion.
Let’s say that the price of each item, as well as the currency in which it’s sold, is a major focus of the report. If that’s the case, it’s worth incorporating a new column that gives details about the countries the product is sold in.
Set up a column for the remaining inventory
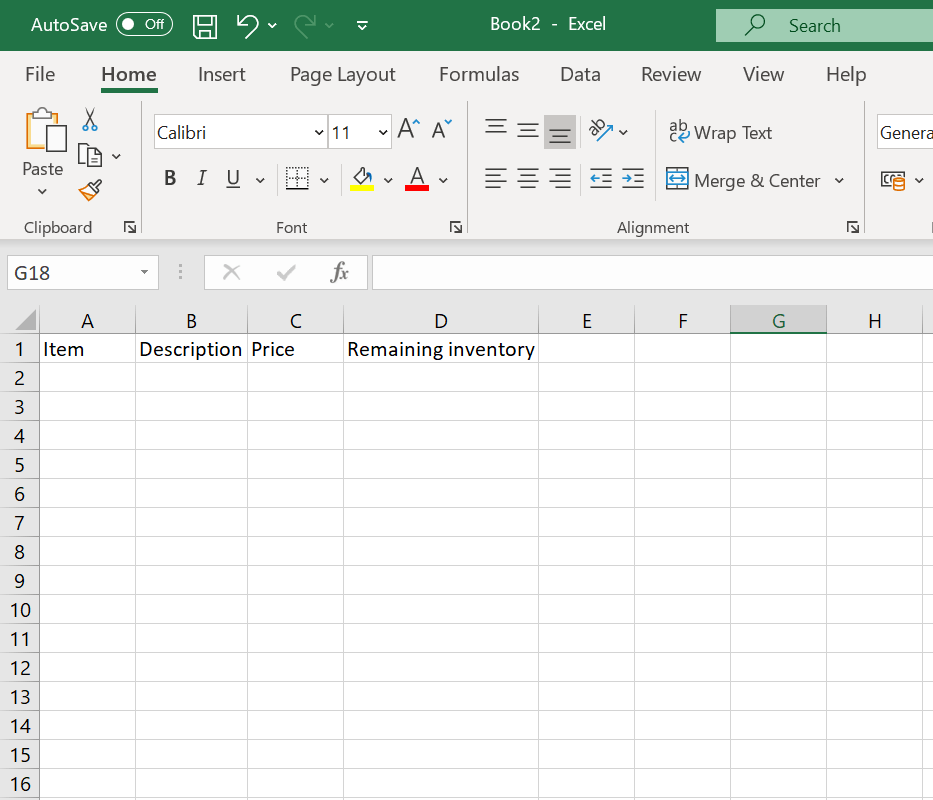
Your report needs to show anyone who looks at it exactly how many of each item is still available. To make this information easily accessible, it’s vital to create a column that clearly shows how much inventory remains.
Depending on how detailed you’d like your report to be, it’s also a good idea to enter the location of each item of remaining inventory. This is particularly helpful to inventory managers.
Also, if your business relies on more than one warehouse or storage location, it’s very helpful to know precisely how many items can be found at each location.
Determine the timeframe
Reports give you an accurate idea of your inventory during a specific period—but you’ve got to establish the exact length of the date range in question. That’s what you’ll be doing in this step.
Maybe you’d like to have an overview of your inventory that covers the last week. Alternatively, you might prefer to find out how your inventory has fared this past month, quarter, or year.
The important thing is to be as exact as you can be. The more closely you’re able to define the start and endpoints of your timeframe, the better.
Generate the report
The last step is the least complicated one.
Now that you’ve input your information and fed the software all the information it needs, you’ll be able to generate the report itself.
The exact method you use will depend on the inventory reporting software you’re using as well as the type of report you want. If you’ve created the report in Excel and you don’t need any visual information beyond the table you’ve set up, you probably won’t need to do anything else to get the report to its final state.
In other programs, you might have a “create report” button or something similar that will convert your information into the format you want.
Importance of inventory control reports
It’s always beneficial to your business to be able to say you have a complete understanding of everything relating to its stock. In other words, knowing more about your own stock levels through inventory tracking can only help you run your company more effectively and profitably.
This is the essence of why an inventory control report is necessary.
Going into a little more detail and scheduling in a monthly inventory report makes it easier to keep track of the way your business is running. With monthly—or even weekly—reports, you can clearly see what’s selling, where you need to improve, and which items to take out of your rotation.
Inventory reports tailored to your business make sure you’re always in the driving seat and help you carry out other detailed and informative tasks such as inventory forecasting.
Get accurate inventory reporting with Inventory Planner
So as you can see, your regularly scheduled inventory report should be one of the key elements in your business intelligence toolkit. The benefits are clear to see.
The functionality of inventory reports gives you greater control over your inventory levels and informs you of the number of units you have and need, thus allowing you to avoid overstocking or understocking. They also provide crucial insights to guide decisions that can boost your bottom line.
So why not ensure your inventory reporting is as accurate as possible?
Inventory Planner lets you do just that. Get your demo and experience the difference that accurate and intuitive inventory reporting can make to your business.