As any merchant with multiple locations or more than one sales channel knows, each location is unique. Products that sell well on Amazon may not be the same ones that are popular on your own site. Locations in different parts of a city, across the country, or in different countries will see different sales from one another. A product that sells well in one location doesn’t in another.
As part of demand planning, we start by looking at customer demand to see what inventory adjustments need to be made to prevent stockouts and avoid overstocking. The bulk of adding to inventory comes in the form of receiving purchase orders from suppliers.
Efficient Stock Level Optimization Among Multiple Warehouses
When managing multiple warehouses, though, it’s important to keep an eye on how stock is balanced among locations. It can be more cost effective to shift inventory from one location to another rather than ordering more product from the vendor.
Optimizing your stock levels across locations can be tricky. You don’t want to send stock to one warehouse only to create a stockout in the source warehouse. For this reason, we use demand planning to identify available stock. This is the amount of inventory on hand over and above what will be needed to meet customer demand at the source warehouse.
For example, our New York warehouse will need 5 green chairs to meet customer demand and there are none in stock. The Boston warehouse has 10 green chairs in stock, and only needs 3 to meet customer demand. There are 7 green chairs of available stock. Of these, 5 can be sent to the New York warehouse to meet customer demand.
To expedite this process across all variants and locations, Inventory Planner recently introduced the Compare Warehouses report. Here, you can see forecasted demand, current stock, replenishment needs, and importantly, the available stock from other locations. Using this report, you can quickly create warehouse transfers to balance stock, ensuring it is in the right locations at the right time for your customers.
How to Optimize Stock Levels Using Inventory Planner
Report Set-Up
First click Reports from the left menu, then Compare Warehouses.

Choose a warehouse at the top of the screen.

This selection will correspond to information shown in Details.


Then select which warehouses you would like to compare to this warehouse using the ‘Compare To‘ button in the upper right corner.

Note: The date range of this report correlates to historical metrics such as sales and revenue, which you can add to your view using the gear icon in the upper right corner to select columns. The date range in the Replenishment screen determines how the forecast is calculated. The Replenishment date range will also determine replenishment recommendations and overstock.
Reading the Report

Once you have added a second location using the ‘Compare To’ feature, you will see new columns for Available Stock and Total Available Stock.
Available Stock is inventory on hand at that location in excess of what will be needed during the days of stock (planning period). This metric is based on the lowest amount of stock needed (based on the forecast) during the days of stock. Any inventory available over that amount is identified as available stock. (Note that Overstock is excess inventory after the days of stock. Available stock is excess inventory during the days of stock.)
Total Available Stock is the sum of Available Stock from all compared locations. This field will appear as zero if no warehouse is set to compare to (since there is no stock available to transfer until you have a warehouse for reference). Once you set a warehouse to compare to, this field will populate.
Available stock can be transferred to another location to meet replenishment needs rather than order additional product from your supplier.
If you would like to see only variants that are needed at your warehouse (selected at the top center of the screen) and where quantities are available in other warehouses, use filters. First click Filters > Replenishment with a minimum of 1.

Then add another filter for Total Available Stock to be at least 1.

Finally, click Apply Filters to see results.
Creating a Transfer
Once you’ve determined which products have available stock and can be used to meet replenishment needs at another location, you’ll create a transfer. First select items to be transferred.

Then select ‘+ New Transfer for Variants‘.

You will then select your Source warehouse (origin of available stock) and your Destination warehouse (where stock is sent).
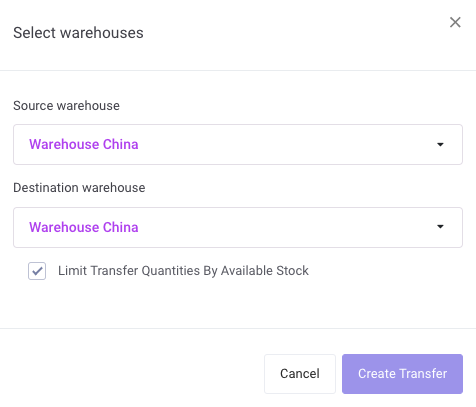
By default, you will limit the quantity of stock to transfer to the Available Stock in the Source warehouse.
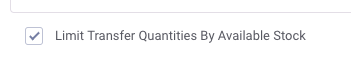
This helps to ensure that you aren’t moving too much stock out of your Source warehouse.
Finally, click Create Transfer.

At this point, you can adjust information and quantities just as you would with a purchase order or other warehouse transfer.
When you click ‘Save‘ at the bottom of the page, the transfer is created.

On the Purchase Order dashboard, you can now see the transfer listed.

Interested in learning more about Inventory Planner? See how demand forecasting will help you save time and make more money.
