This guide was originally compiled as a compliment to Inventory Planner’s presentation as part of the Shopify Compass series on planning for Black Friday / Cyber Monday sales. Click here to learn more about how Inventory Planner helps Shopify merchants forecast customer demand, saving time and money while managing inventory.
Forecasting holiday stock needs during a year that has seen spikes, slumps, and no end of complications is no small task. In any year, the fourth quarter provides the bulk of profits for many eCommerce businesses. Plan early to make the most of Black Friday and Cyber Monday sales.
Contents:
I. Creating a planning calendar
August – September
*Products with lead time over 60 days will need to start sooner
1. Create a calendar with key dates.
There may be others that apply to your niche and customer base. To start:
- Thanksgiving
- Black Friday
- Cyber Monday
- Giving Tuesday
- Green Monday
- Free Shipping Day
- Hanukkah (start/end)
- Christmas
- Kwanzaa
- Boxing Day
- New Year’s Eve/Day
Consider shipping cut off dates and add them to your calendar. When is the last day for a customer to order using standard shipping to receive their order by Christmas?If you offer expedited shipping, let customers know those final order dates too.
2. Coordinate which items/categories to emphasize
Work with marketing, merchandizing and other relevant departments in your company to make sure the items purchased fit with customer demand, marketing campaigns and produce desired profit margins. Consider:
- Buying trends from last year. What categories or attributes sold well during the same time last year?
- Trends from non-seasonal sales this year. What hot new trends can you incorporate in your holiday merchandising?
- Are you going to launch new items? Are there holiday-specific items to make available during the fourth quarter?
3. Decide which items are needed and when
Do you need Thanksgiving-related items by Halloween? Are Christmas/Hanukkah items needed by one week or more before Thanksgiving? Add the timing of stock arrival into your planning calendar.
For Inventory Planner merchants, add this info to the Edit Forecast section so that you are purchasing at the right time.
Consider if you should change your typical Days of Stock setting (planning period) for these items. If you typically plan to have enough stock for 21 days but want to cover 45 days of availability for the holidays, then ensure you’re reflecting this in your forecasting.
4. Check with suppliers
Touch base with key vendors to ensure you’re both on the same page for holiday inventory needs.
- Are promotional prices available? Even if discounts are not advertised, it doesn’t hurt to ask!
- Are pre-sale (early order) discounts available?
- Will there be changes to the lead time? Do they anticipate any production delays or backorder issues?
- Will there be changes to shipping time?
- Do they have holiday shutdown dates? Are they open on Black Friday? Between Christmas and New Years? Do they close for other holidays?
5. Plan cash flow
Now that you know when you need to have items available and when to place orders, when you will you need to pay for your purchasing. What are your supplier terms? Are payment terms different for pre-sale items?
To estimate revenue for the current year, consider:
- Expected revenue (based on last year + annual growth rate)
- Seasonal expenses (labor, shipping, warehouse space)
6. Increase lead time and days of stock as needed
Consider if you need to alter your days of stock. For example, if you typically plan to have 14 days of stock on hand, but want to place one order for to last 45 days during the holidays, you’ll need to alter your forecast.
7. Check on health of settings and data for ordering
Clean up your product data and forecasting information. Important items to check include:
- Discontinued items – remove from forecasting view or grouping of products to be replenished
- Set up units of measure (case size), minimum order information and other ordering parameters
- Update costs
- Note discounts
- Input cubic measurements – both for supplier order and for customer order shipments
- Mark items as seasonal as needed. This will reference sales trends from the prior year rather that the last few months.
8. Place orders according to schedule
Now that you’ve created your schedule and adjusted lead time and days of stock, start ordering to coincide with when you will need product.
October
9. Plan for stock audits
Does your warehouse and fulfillment team conduct a full audit of your products? Or do you audit when a stock discrepancy is found?
If you’re conducting a full audit, what is the procedure? How many people are needed? What are key dates when you will audit your stock count?
10. Plan contingency for slow sales during holiday season
Create a contingency plan before Black Friday so that you know what dates you will examine sales. Have a plan of action for which levels of sales volume that will trigger promotions or needed reorders from your suppliers. Make these decisions now so that you can act quickly when needed.
November, December, January
11. Monitor sales at key dates
Using your contingency plan, monitor sales for additional promotions or reorders you will need in order to react to customer demand.
(wait until January if promotions will only happen after the holidays)
II. Forecasting fundamentals
Whether you run an eCommerce site or are stocking a brick and mortar store, inventory forecasting is crucial to the financial success of your business. Too little inventory on hand and you miss out on sales. Too much on your shelves and you’ve tied up cash that could be used to build your business in other ways.
So how do you strike a balance between optimizing stock levels and managing cash flow? Inventory forecasting can be a powerful tool to help you do just that.
What goes into a forecast?
To figure out what inventory you should have on hand, start with a forecast of future sales. Sales for the coming 30, 60 or 90 days are based on past sales velocity and seasonality of products.
For an accurate forecast, consider:
- Sales velocity is the rate of sales omitting stockouts (out of stock days). We use sales velocity rather than average sales over the past 30 days because we want to know the rate of sales if inventory was fully stocked. If you don’t omit days when inventory was out of stock, then you could underestimate future sales.
- Seasonality will inform if the emphasis for past sales should be on the most recent months or should be on trends from 12 months prior.
- Sales trends show if demand is steady or increasing in recent months.

How should you handle seasonal products?
Seasonal products need to be treated differently from other products. A seasonal product is one that sells at a significantly different rate during a particular time of the year. Seasonal products can include items for sale around certain holidays. They can also be items like items in a spring collection or winter sports gear.
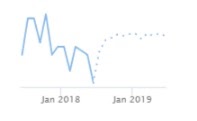
Let’s look at an example:

The default forecast projects steady sales from month to month.

The seasonal forecast follows seasonal trends shown the prior year with spikes in sales in December and May.
Unlike other products that sell at a steady rate all year or ones see an increase in sales month over month, seasonal products have different considerations when calculating your forecast. The default sales forecast will emphasize sales in the most recent months, taking into account if sales are increasing, decreasing or holding steady. A forecast for seasonal products references trends from the prior 12 months.
How do you forecast sales for new products?
New products without sales history present a particular challenge to creating a demand forecast. There are two approaches:
Consider trends for other new product launches.
Have other new products increased sales rapidly immediately upon release? Or, is there a period where the new product is marketed to customers and sales increase slower over several weeks or months? Examine the month over month increase for other new products. This approach assumes that similar product launch plans and resources will be invested in the new product.
As an example, previous product launches with gumballs, lollipops and licorice saw strong sales the first two or three months, then a drop off during the following months.


Applying that to our new product in jelly beans, we can estimate that there will be drop in sales after two to three months.
Look to sales trends within the same product category or brand.
Is there a particular type of product that sells well during summer months? Or does one brand attract loyal buyers who will immediately consider a new release.
For example, Jill’s Jelly Beans shows solid sales across all available flavors. When considering Orange as a new flavor release, we can look at the sales velocity of Lemon and Lime flavors to approximate the future sales for Orange Jelly Beans.

Looking at other flavors, we see a pattern of a strong increase in the second month after launch, then a decline followed by another increase. Seeing this pattern in several other launch flavors can inform how the new Orange Jelly Beans will perform.
How do you handle promotions when forecasting?
Your default forecast shows predicted sales continuing on the current demand trend. Promotions should change that trajectory, so how do you handle them when creating a forecast?
Future promotions:
If you are planning a promotion during the forecast period, you will need to increase the forecast. Consider:
- Does the past sales information include previous promotions?
- If so, consider that the sales velocity already includes increased sales due to promotions
- If not, you will need to estimate how much your promotion will increase sales
- Keep in mind cost of lost sales due to stockouts.
- Promotions can lower margins so be use to factor that into your revenue planning.
Past promotions:
If past promotions occurred during the period used to calculate the sales velocity, you may not need to increase the forecast – or not by much.
What is the difference between a forecast and replenishment?
A sales forecast looks at the predicted sales for the next 30 days (or time period of your choosing).
Replenishment is the additional amount of stock needed to cover those sales. Replenishment takes into account:
- Consideration of current stock levels – How much is already on hand? How much additional product will be needed?
- Lead time from vendors – how long will it take from placing a purchase order with a supplier until that product is received into inventory?
- Stock on order – how much product is already ordered from your supplier and is scheduled to arrive during the time period under consideration.
If you are forecasted to sell 300 Lime flavored Jill’s Jelly Beans during the next 30 days, this is the sales forecast. If you have 60 on hand and the lead time is 3 days, the replenishment will be 270. Our sales velocity is 10 per day. My current stock will cover 6 days. Since the lead time is 3 days, we still need to cover 24 days of sales. At 10 per day, that is 240 to cover the remainder of the 30 days.
Are you under or overstocked? How much overstock do you have?
Wondering if you have more stock than you’ll need for the next 30 days? Or maybe you know you have too much – and you’re wondering how much overstock you have on hand? We can use the forecast to figure out how much stock should be on hand.
First, determine how many days of stock you want to have on hand. Days of stock are the number of days you want to cover with inventory stocked in your store or warehouse. Some considerations when determining your days of stock include:
- Lead time – how long will it take to receive products from your supplier? If you have a short lead time, you could also have shorter days of stock. However, if it takes 90 days to receive a new order from your vendor, you will want longer days of stock. Consider that days of stock is approximately equal to how often you will need to place an order. You wouldn’t want to place an order every 14 days if it takes 90 days to get to you, leaving you with multiple orders in transit.
- What is the cost of being out of stock? That is, how much does each lost sale cost you? If an average day out of stock would cost you $10,000, you may want to have more stock on hand than if each stockout would cost you $100. To determine the cost of being out of stock for a day multiply your sales velocity per day times the retail cost of your product.
Now divide your stock by your sales velocity per day. Subtract that number from your targeted days of stock and that will give you how many days you are under- or overstocked.

For example: You have 1000 candy bars in stock. Inventory should cover 30 days of sale and you sell 10 per day.

Now you know how many days of overstock you have based on the current sales velocity.
III. How inventory affects your company’s financial health
The finances of your inventory depend on each business, but with three metrics – margins, understock, and overstock – you will be able to determine where you need to have your inventory to optimize your profit and invest those profits back into your business.
Margins
Profit divided by revenue will show you your margins. Of course you, as a merchant, must cover the cost price (what you pay your vendor). But you must also have enough margin to pay for the rest of your overhead costs including salaries, rent, marketing and other expenses.
How do you calculate this? Consider non-inventory expenses and ensure you are building in enough margins so that you are able to cover that as well. Those expenses include the rest of your overhead, and part of that function is volume. However, if you don’t have sufficient margins, no amount of volume is going to save your business. Take a total-business look at fixed and variable costs. How much do you really need to cover? What are appropriate margins?
Understock
Understock and stockouts are dangerous to your inventory financial health. Look at your replenishment needs. You are missing out on sales when you are understocked or have stockouts. One key metrics to consider is forecast lost profit (stockouts during the lead time multiplied by profit). What are you missing out on in terms of profit?
Lead time is how long it takes to get your merchandise once you place the PO. That is the very quickest time you can get the items in. You are losing out on revenue for every day you have a stockout.

You can also look at replenishment retail value. What is the revenue you can bring in based on the forecasted replenishment needs? For all these units forecasted in order to meet demand, take replenishment times price to get the replenishment retail value. That is another way to look at future revenue you can get in for these items if you order them.
When deciding what items to replenish, consider using an ABC class analysis of recent sales. That looks at each variant or product’s contribution to your revenue over the last thirty days. Alternatively, you could calculate the contribution to your profit instead of your revenue to maximize your return on investment.
To calculate the contribution of each variant to your total revenue, divide the variant revenue by the total revenue. Then sort variant contributions from highest to lowest. Finally, create a running total or cumulative sum of the variant contribution.
The variants contributing to 80% of your revenue are considered A class items. The next 15% of variants are B class, and the final 5% are C class items.
The highest priority is keeping A class items in stock when determining replenishment priority because that is what is delivering revenue. Then determine if C class items are worth the investment. Alternatively, you could potentially eliminate C class items since they contribute the least amount to your overall revenue. The cost (fixed and variable including time to maintain inventory levels and storage costs) may outweigh the contribution of C class products to the revenue.
Overstock
Look at your planning period (lead time plus days of stock). What will you have on hand past that date? This is your money sitting on a warehouse shelf. Items in stock beyond your planning period are tying up capital that could be generating a better return on investment elsewhere – that could be used buying different inventory, or it could be in another area of your business such as advertising.

Here are the number of units and their retail value. Keep in mind overstock retail is going to be the full retail value of your overstocked units. There is a high probability that you could discount this amount.
Look at how steep your discount is going to be. If your brand proposition is quality, then you should consider shallower discounts. If you want to move through quantity, then you can do steeper discounts so you are not sitting on that inventory any longer than you really need to. Think about your overall brand value as you are discounting. There are a variety of approaches you can take to move out overstocked inventory.
IV. How much stock is ‘enough’?
A crucial concern when optimizing your inventory is determining how much stock to hold. Generally speaking, we know that overstock means cash is sitting on the shelves when we could be using it elsewhere, and understock means we’re missing out on sales. But what is the right amount of stock to have on hand? What is ‘enough’? Here are key considerations for determining how much stock to have on hand for your business.
Risk tolerance
Consider your risk tolerance as it relates to stockouts (running out of inventory). Is it most important for you to be in stock at all times? Is reliability and availability part of your value proposition to customers? If so, you are more likely to be overstocked as part of building in a buffer for supply chain issues that can come up.
Or, is it more important to tightly manage cash flow so that you don’t have too much capital tied up in inventory? If cash flow is your paramount concern, then figure into your consideration the cost of lost sales due to stockouts. You may find the opportunity cost of using cash elsewhere in your business outweighs occasional lost sales.
Using inventory forecasting and demand planning, you can forecast the cost of lost sales per item per day. Look at the margin of each product to determine your forecasted lost profit. That will help to determine if spending money on inventory is your highest priority – or if that capital is better spent elsewhere in your business.
Stock cover
How long would you like your stock to last? Another way to think of this is, how often do you want to reorder inventory? Stock cover (also known as days of stock) is the length of time that your current inventory will last based on the sales velocity for that item. Sales velocity is calculated as units sold divided by days in stock.
Note that sales velocity is different than average sales because it takes into consideration days when the item is in stock. If an item is out of stock and therefore as no sales, then figuring sales velocity is more accurate. Using average sales can lead to under-forecasting…which leads to more stockouts. Break the cycle – use sales velocity instead of average sales for forecasting calculations!
Like risk tolerance, determining your ideal days of stock depends in part on your priorities. If cash flow is your primary priority, then you want to know how quickly you can turn new inventory into sales which can then be reinvested into more inventory. Knowing your sales velocity, how quickly can take $10,000 worth of inventory and sell it for $20,000? Does it take 7 days? 30 days? 90 days? The longer it takes to produce a return on your initial investment, consider the opportunity cost of using your capital to buy inventory. What could you do with $10,000 worth of inventory that will take 90 days to sell? Is there a different product that you could make $20,000 on quicker?
Vendor considerations
Supplier conditions may also play a role in determining your ideal level of stock on hand. Is there a minimum order quantity (MOQ) or minimum budget you need to meet when placing an order? If there is an MOQ, then you may be forced to purchase 90 days of stock when you would ideally like to store only enough inventory to cover 30 days.
Another vendor-related factor that may influence your decision is how quickly can your vendor produce new items? Are you ordering custom items with a long lead time? Your forecasting should consider your lead time so that you place purchase orders in time to avoid stockouts.
What about product-related costs like shipping, taxes, and duties? These expenses should figure into your calculations for how much inventory to order each time. Consider products with very low shipping costs. You may able to order those items more frequently. Conversely, if high shipping costs add significantly to your product costs, then you should explore what you can do to lower the impact of those costs. Is it less expensive to ship one large order rather than several smaller orders?
Not all products are equal
Not all products in your store need to have the same priority for replenishment. Consider using an ABC class analysis of recent sales. An ABC class analysis looks at each variant or product’s contribution to your revenue over the last 30 days. Alternatively, you could calculate the contribution to your profit instead of your revenue to maximize your return on investment.
To calculate the contribution of each variant to your total revenue, divide the variant revenue by the total revenue.
Variant contribution = variant revenue / total revenue

Then sort variant contributions from highest to lowest.

Finally, create a running total or cumulative sum of the variant contribution.

The variants contributing to 80% of your revenue are considered A class items. The next 15% of variants are B class, and the final 5% are C class items.

When determining replenishment priority, you can prioritize A class items so that you do not run out of stock and ensure that you replenish those items first. Remember, this will involve some level of overstock that goes beyond your ideal days of stock. B class items have next priority where you do not carry as much overstock. C class items could be items where you tolerate occasional stockouts – or even eliminate these items since they contribute the least amount to your overall revenue.
Not all locations are equal
If you’re using a third-party logistics (3PL) company to manage your fulfillment or if you’re selling on Amazon (Fulfillment by Amazon – FBA), then you can clearly see the cost of storing your inventory over time. Click here to see updated FBA fee schedules. Similarly, 3PLs often charge based on how much space inventory takes up in their warehouses, and can add a long-term storage fee if items are around for too long.
Even if you’re handling fulfillment in-house, there is a real cost to storing your inventory. When managing multiple warehouses, look at each location or selling channel (as with FBA) to analyze the associated storage fees. Figuring in each location’s storage fees can help to show where you’re adding costs that may eat into your margins.
Special forecasting considerations for this year
Cash flow is always top of mind and never more than now. Here are some tips.
- Reevaluate your forecasting method. If you normally reference two years of sales history to calculate the sales velocity of an item, it’s worth looking at a much shorter time period. Daily habits are changing for most consumers.
Tip:For Inventory Planner users, this means changing to the ‘Last Sales’ forecasting method. - Keep in mind when using a short sales history calculating the forecast, this can be very volatile. Each day’s sales will have a large effect on the calculation.
- As always, keep in mind when you’ve been in stock and out of stock. When possible calculate the sales velocity only using in stock days. This will make a huge difference in your forecasted demand if you’ve had stockouts. Read more here about how stockouts affect a forecast. The goal: How much do customers want when this item is available?
- If your revenue is dropping and cash flow is tight, prioritize your ordering/replenishment needs. What items have the highest ROI? Metrics to watch: forecast lost profit, replenishment profit, and replenishment retail. Here’s more detail about replenishment metrics to watch and how to calculate them.
- Another option: ABC Analysis. This identifies what contributes the most to your profits. The top 80% of revenue comes from A Class, the next 15% from B Class, and the final 5% from C Class. Here’s how to calculate your ABC Analysis.
- If you stock multiple warehouses or locations, consider the needs of each one, not just your company’s aggregated inventory demand. Each location has its own personality – different things sell at different rates in each location. Here is more information about forecasting for multiple warehouses or locations.
- Consider reducing your Days of Stock (AKA ideal stock cover). Inventory sitting on your warehouse shelves is money you can’t use elsewhere in your business. Especially while things are changing quickly, focus on small orders to vendors made frequently.
- Talk to your suppliers to see if they can lower minimum order quantities. Vendors are likely struggling too and a small order is better than no order (not the case 100% of the time, but worth having the conversation).
- Check with suppliers to see if lead times have changed. Suppliers in many countries may be facing labor shortages or dealing with other limits on production. (While checking in, be sure to ask how they’re coping with the outbreak.)
- Shipping times are slow and they will only get slower during the holidays. Carefully consider shipping cut off dates this year to allow for this.
- Plan inventory ordering ahead of time to allow for additional shipping time, especially when sourcing overseas.
- Prime Day is moving from its traditional date in July to October in 2020. Review sales data in 2019 to see what increase in demand you saw in July. Even merchants not selling on Amazon can see a bump in sales during this time, so it is worth checking. Use Prime Day to test marketing and up-selling strategies that you can use during the holidays.
- Were you out of stock during the last few months during a spike in demand?
- What is the trend since lockdown? Many saw a spike in April/May and demand dropped in July.
- Trends: look at year over year and recent trends. Look at recent trends first. Then see what typically happens inNovember and December compared to the rest of the year.
- How can you plan for higher traffic due to the lack of in-person sales events happening at big box stores?
- Are there special inventory/shipment restrictions at my warehouse, 3PL, or Amazon warehouse?
- Are there penalties for keeping current overstock at your warehouse, 3PL, or Amazon warehouse?
Bonus:Check shipping carrier data and delays complied by ShipBob.
VI. Forecasting for new products
Keeping your product catalog fresh can be an important part of bringing customers back for repeat purchases. Few things are more exciting than bringing new inventory into your catalog.
How will customers react to new products? How can you tell if they are selling well enough?
Short of consulting a crystal ball, it can be a mystery to figure out how much to order without prior sales history. Here are some key points of data to use as a guide for placing your initial order.
Look at other new product launches
Consider what you have done in the past since this is the most readily available data. Have other new products increased sales quickly upon release? Or does it take your customers weeks or months to warm up to a new product? Examine the month-over-month increase for previously launched products, assuming similar launch resources and plans are being invested in this new product.
As an example, previous product launches with sundresses, maxi skirts, and swimsuit coverups saw strong sales in the first six weeks, then a drop-off during the following months.
Applying that to our new styles of beach-ready summer dresses, we can estimate there will be a drop in sales after six weeks.
Look at trends within the same category or brand
Look at products with similar attributes to your new line. This could include category, collection, brand or vendor.
For example, Cora’s Candles show solid sales across all available scents. When considering Gingerbread as a new scent release, we can look at the sales velocity of Christmas Tree and Spiced Cider flavors to approximate the future sales for the Gingerbread candle.
Looking at other scents, we see a pattern of a strong increase in the second and third months after launch. Seeing this pattern in several other launch scents can inform you how the new Gingerbread candle might perform.
History of the option sets
Option sets are different colors, sizes, or flavors of the same item. For example, when you look at t-shirts, you can look at the history of the different sizes (small, medium, large, etc.). The proportions each size sells at will guide your initial order of the new t-shirt. If you sell 25% size small, 50% mediums, and 25% larges, use this distribution when determining sizes of the new style to order.
Merging sales history of similar products
Merging sales history is ideal when you have an old product being phased out and a new product coming in that is very similar. Link the sales history to the new product so that even though you don’t have any sales history, you have a good idea how it is going to sell based on the old one.
An example here is a food item selling in a 2 oz. size and being replaced with a 2.1 oz. size. Merge the sales history so you can see how the 2.1 oz. will perform based on how the 2 oz. size sold. The change in size is not significant enough that we expect a change in the rate of sales.
How to handle seasonal product with a short sales history
Top-down forecasting uses sales trends for categories and forecasts the future sales based on the product contribution to the category.
Seasonal forecasting references what happens 12 months ago. If you look ahead to how a product sells in August 2019, you must look at how it sold in August 2018 and even August 2017. When you have seasonal items with less than 12 months of sales history, consider using top-down forecasting.
If an item has only been for sale this summer, you must use top-down forecasting because we know this category is seasonal. Take sunglasses: They tend to sell better in the summer, not the winter. Use that seasonal trend.
Once you have a little sales history, you know a particular sunglasses style contributes to 2% of the unit sales. Tack that 2% to the seasonal wave. As the category dips in the winter, you are looking at 2% of that lower number will be forecasted to your new seasonal product with only a little sales history.
VII. Prioritizing replenishment
With so much data available, it can be difficult to figure out where to start when prioritizing what you need to order based on customer demand. Keep in mind that not all of your inventory and not all of your replenishment needs are going to be the same.
Take a look at a couple of different metrics:
Forecast lost profit
How much will you miss out on if you don’t order these items? That can help to put things in perspective. If you’re going to miss out on $100, $200, maybe that’s just low priority. It’s not worth your time to go through replenishing those items. If you’re going to miss out on much larger amounts, then that is worth your time and that’s a much higher priority. That can also help if you’re strapped for cash or you’re thinking about cashflow needs, you can really figure out, “What do we need most urgently and what can we wait on?”
Forecast lost profit is calculated as stockouts during the lead time * (price – cost price)
Stockouts are the days when a product is out of stock.
The forecast is the projected customer demand shows as sales in units for the “days of stock” period. The forecast is calculated using the sales velocity and the sales trends in recent months (are sales increasing or decreasing?). Sales velocity is the rate of sales excluding out of stock days. Seasonal products emphasize the sales trends from the prior year rather than the most recent months.
Replenishment retail value
What does the retail value, the revenue that you’re going to bring in when you replenish the items that you need? Even better yet, look at your replenishment profit. How much are you really going to make once you take out your expenses based on the number of items that you’re ordering?
Replenishment retail is the replenishment * price.
The retail value of products to cover the “days of stock” period. Retail price is the price the customer will pay.
Replenishment profit is the replenishment * (price – cost).
The expected profit of products needed to cover the “days of stock” period.
Determining ABC Classes
To calculate the contribution of each variant to your total revenue, divide the variant revenue by the total revenue.
Variant contribution = variant revenue / total revenue

Then sort variant contributions from highest to lowest.

Finally, create a running total or cumulative sum of the variant contribution.

The variants contributing to 80% of your revenue are considered A class items. The next 15% of variants are B class, and the final 5% are C class items. You can change those figures if you want, but for our purposes, we are sticking with the 80/20 rule.

You can prioritize A class items when determining replenishment priority so that you do not run out of stock and ensure that you replenish those items first. Remember, this might involve some level of overstock that goes beyond your ideal days of stock. This will act as a buffer to deal with any supply chain issues that might arise. B class items have next priority where you do not carry as much overstock. C class items could be items where you tolerate occasional stockouts—or even eliminate these items since they contribute the least amount to bottom line.
VIII. Identifying and clearing overstock
Optimizing your stock levels requires paying attention to both understock and overstock. Once you forecast customer demand and ensure that you have enough stock on hand to meet upcoming sales, the next step is to clear out overstocked inventory. Liquidating excess stock generates cash that you can invest elsewhere in your business including marketing and inventory with a higher turnover rate.
There are a variety of ways to sell off overstock, but one of the quickest ways is to sell in bulk. Here are some time-tested tips to help you move out overstock as quickly as possible.
- Experiment with bulk options to see what works for your customer base. Try different selling options. Check sales history to see how many customers are buying in a single order now. Add options at and above the average. People like to choose the middle option. By presenting larger options, you’re giving customers the opportunity to buy more at a better value. Customers who choose larger options are a bonus and bring up your average order value.
- Don’t overwhelm customers with too many options. Inundating customers leads to decision paralysis and then they bounce from your site. Pare down options to see if it increases conversion rates. It sounds counterintuitive that buying will increase with fewer options – but this works!
- Factor in the marginal cost of shipping larger quantities. With many (most? nearly all?) eCommerce companies providing free shipping, think about how your cost per order drops when you are shipping one large order to a customer instead of two smaller orders on two different dates. The cost of one large shipment is lower than the cost of two smaller shipments. What can you do to incentivize them to purchase in bulk and increase the size of their cart?
- For brands that do not want to have a race to the bottom in terms of pricing, think about how to reframe the discount of bulk pricing to add value to your brand. For example, if a customer buys 50 units, provide them a voucher for $5 toward their next order. This method helps to encourage users to come back and become frequent shoppers.
- Most importantly, A/B test to find what works for your customer base. Every business has to find the right fit that works for their customers. What works for one business may not work for the next. Try out different approaches – number of options, higher quantity options – to pin down what works for your customers.
Bonus:Clearing overstock after the holidays
If you do have stock leftover after the holidays there is still plenty you can do to focus on moving out underperforming and seasonal products. Here are some ideas to take into consideration for clearing out overstock that will appeal to online consumers:
1. Encourage buying in bulk
Who doesn’t love a good deal? Offer discounts of 5-15% to customers who buy overstocked items. These transactions can have multiple overstocked products per sale.
2. Sell at a discount
How quickly does the merchandise need to be sold? The higher the discount, the quicker the item will sell. Flash sales not only create a sense of urgency, but they can also be tailored to very specific merchandise. You can also generate flash sales based on customers’ browsing history.
3. Bundling
This is a chance to think outside the shopping cart. Are there underperforming items in stock? Bundle them with bestsellers to increase average cart size and reduce overstock. Get creative with the packages that you offer.
4. Promotional gifts
Using excess stock as promotional gifts rather than discounts emphasizes quality over quantity. Do you have a high-value, low-costquality item that you have in bulk? Consider this as an option.
5. Offer free shipping
A Wharton School of Business survey showed that a free shipping offer of $6.99 appeals more to customers than a discount that cuts the purchase price by ten dollars. (http://knowledge.wharton.upenn.edu/article/how-the-offer-of-free-shipping-affects-on-line-shopping/) Never underestimate the power of free shipping! Why do you think Amazon Prime as taken the world by storm?
6. Return to the vendor
Whether asking for a refund, direct exchange, buy-back, or credit, this is not a guarantee, but it is certainly worth investigating! Even if the vendor will not negotiate, you can always find a jobber (a small-scale wholeseller) to take the inventory off your hands.
7. Donate
Check with your tax professional about the new 2018 tax laws that went into effect in the United States, which makes the standard deduction larger than in previous years. Take into consideration the donation value and what time of year it was given, but this can turn into marvelous marketing and PR for your company.
Even if you are left with excess inventory in the first quarter, there are still many ways to reduce that inventory to produce cash for use elsewhere in your business.
IX. Planning for next year including Chinese New Year
Merchants who order inventory from China must understand patience and planning are vital when preparing for the Chinese New Year (CNY). What is the best way to ensure there is enough inventory to avoid overstock during this fifteen-day holiday, one of the most celebrated festivals on the planet?
Before we can worry about stockouts, it is important to understand the timeline of the CNY, because it is different from the Western holidays of Christmas and January 1st. The date of the CNY changes based on the lunar cycle, and can occur any day between January 21 and February 20. It is typically the second new moon of the winter solstice.
Many workers take the week before the New Year off, and depending on the supplier they work for and the part of the country they are located in, they will not return to the production line until two or three weeks after the CNY.
That is nearly an entire month of production lost. So what can vendors do ensure there will not be overstock during the long holiday?
Just as with the holiday season in November and December, careful planning and good communication are essential to avoid overstock. Consider the following steps to take to prevent stockouts during CNY.
Use demand forecasting. Pay attention to lead time and days of stock in sales forecasting. It will be important to increase the days of stock. For example, you normally have 14 days of stock of a particular item on hand based on sales velocity. Obviously 14 days will not carry you through CNY. If you know the manufacturer shuts down for 30 days, increase days of stock to 30 for the four weeks they are closed because you cannot order during that time.
Don’t forget shipping times. Vendors must factor in shipping times after CNY. Items could be held up on either side of the ocean. Going back to our previous example, vendors should consider carrying 30 days of stock plus 7 days of freight for a total of 37 days of stock. You can go back to regular stock levels after CNY, but check with manufacturer to see if their lead time is increasing to produce with their backlog.
Ask lots of questions. Your liaison with your supplier is your first line of defense when planning for CNY. Here is a list of questions to ask them before businesses close in China for CNY:
- How long will you be closed? Each supplier will be closed for different lengths of time. Carefully note which suppliers will be closed for up to four weeks, and plan accordingly.
- How much notice do you need for orders? Ask when you can place your last orders. Don’t expect many orders to be filled in January. Any last-minute orders you place after Christmas or in January will not be filled until February or, more likely, March. Keep in mind that your suppliers fill orders for other vendors, so this is really a crunch time for everybody.
- When do you expect production to pick back up? It is helpful to know when production will start, when they back orders will be filled, and when they expect to be back at full production. Ask if you can reserve extra manufacturing time to avoid stockouts. This will make for better planning on your end, even if there are additional costs involved.
- Will staff be on hand to answer questions if I need help? While production workers will certainly be gone for a minimum of three weeks, can you work with the sales, engineering, or administrative branches of the company? They are less likely to be gone for the entire duration of the holiday. Will they be answering communication at all during the holiday? Is so, when?
- Do you have stock on hand in case of emergencies? Even the best laid plans can go awry, no matter how carefully you plan. What then? If you have a product that is particularly in demand, your supplier may have inventory they can ship via freight or by air should an emergency arise.
- How long is shipping time? Much of the transportation network will also be shut down at CNY. Expect a backlog in shipping right after the holiday. Can your liaison tell you how long it will take to ship stock after CNY? Can they give you a timeline of when they expect shipping to resume normally?
- Will there be a backlog at customs? How long will it take the first products to reach my country? Expect bottlenecks on both sides of the ocean, especially items leaving China. While it may be difficult to predict exactly how long it will take for your inventory to clear customs in China, your supplier liaison will have the best time estimate available to you. Use them as a valuable resource, and remember the lead time it takes for shipping. If not a problem, keep the regular lead time and go back to regular days of stock merchant was using before.
Open and honest conversation between merchants and manufacturers is paramount. Keep in mind many factories will be closed between two and four weeks. Use inventory software and demand forecasting to analyze such things as days in stock and sales velocity. Increase days of stock to avoid stockouts, and remember to have enough inventory for the CNY holidays closed plus shipping time.
X. Exceptions to the rule
There are exceptions to every rule, and sales forecasting is no different. We;ve gone into depth about the exceptions that may come up and the best ways to deal with them in our article on inventory planning exceptions.
This guide was originally compiled as a compliment to Inventory Planner’s presentation as part of the Shopify Compass series on planning for Black Friday / Cyber Monday sales. Click here to learn more about how Inventory Planner helps Shopify merchants forecast customer demand, saving time and money while managing inventory.